Chief Meteorologist Eric Wilhelm's Blog

  • Home
  • Eric's Bio
  • Weather For Weather Geeks
  • Blog
  • Contact
  • Archives

Winter Forecasts: Can We Actually Get It Right??

October 26, 2021 by Eric Wilhelm

Let’s Do A Pre-Winter Forecast Press Conference

My annual Winter Forecast is coming up on Thursday, November 4th. You can watch the short, “to the point” edition on 21 News at 6&11 and/or check out the long, super detailed, “geeky” version online that same evening. I’ll take some questions now.

Q: Hi Eric, are these seasonal forecasts a real challenge? Are they harder than routine short-term forecasts?

A: Yes and yes. Long range, seasonal forecasting is a relatively new endeavor compared to short and medium-range forecasts. Like with any “young” science, meteorologists and scientists have a lot still to learn…although long range forecasting is light years ahead of where it was just 10-15 years ago.

Q: The Farmer’s Almanac is calling for severe cold and snow this Winter. Do you agree?

A: The Farmer’s Almanac (as well as the Old Farmer’s Almanac) is a fun publication that has plenty of good content. Great bathroom reading! You know what it’s not good for? Weather forecasts. There is almost no science behind the prognostications and it is essentially the same stuff every year. They won’t sell as many copies if they advertise “BORING, SNOW-FREE WINTER THIS YEAR!”. When it comes to the Farmer’s Almanac, just skip the parts dealing with, you know, actual weather.

Q: How are seasonal forecasts made?

A: Making a seasonal forecast is a much different process than constructing the typical short/medium range forecasts you see us present on TV or that you can get on the StormTracker 21 app. In those daily forecasts, forecasters rely on a mix of computer modeling, social science and experience/intuition. Seasonal forecasts use some of that same stuff but what is most useful are what we call “analogs”. We look at data from the past to try and flesh out what may happen in the future. We look for years in the past in which there were similar atmospheric and oceanic conditions as this year.

Examples: This year will feature a La Nina in the Pacific Ocean. So we start by looking at past Fall/Winter seasons that had a La Nina. There’s cool water off the west coast of North America this Fall. Let’s find years that had a La Nina AND the cool water off the coast. And we keep going from there. Once we have a set of analog years we can form a composite picture of the weather that occurred those winters. That makes for a good starting point.

Then we can see what the long, LONG-range models are showing and if they jive with the analogs. Maybe they do, maybe they don’t. This is where experience, extensive research and old-fashioned intuition come in.

Q: Eric good grief. You guys can’t even get tomorrow’s forecast right. How are we supposed to trust a forecast for the whole Winter?

A: Who let Comments Section Guy in here. Anyway, any experienced TV meteorologist has no feelings left to hurt so it’s all good. But, to quote President Biden, “Here’s the deal folks”. I can’t speak for every weather forecast that’s out there for you to consume, but our forecasts are quite accurate. Perfect? No way. They never will be! Sometimes we even have a high-stakes bust. It’s just a fact of life in this business.

But I do keep track of these things and the high temperature forecast you see me give on TV every night is:

For the following day: Right within 3 degrees 90% of the time

For 7 days from now: Right within 3 degrees 40% of the time (within 5 degrees: 57%)

The skill level of seasonal forecasts varies from year to year as some are harder than others. But there IS skill. It’s not throwing darts, it’s not flipping a coin. In fact, millions and millions of dollars is at stake when meteorologists at energy companies make a seasonal outlook. You better believe they are putting a lot of blood, sweat and tears into those outlooks.

Q: The graphic above says it may be getting harder? I though you guys were getting better at this.

A: Forecasting techniques have certainly improved tremendously in recent years. However, yes it may actually be getting harder? Why? Climate change.

Remember the “analogs” I talked about before? The Earth is warming at such a pace that relying on data from several decades ago may no longer be all that useful.

Check out this map of October 2021’s ocean water temperature anomalies.

Now compare this to October 1985, just 36 years ago:

Some of the differences can be chalked up to natural cycles and variability that we \know exists in the world’s oceans. But it can’t be denied that there’s a lot more blue on the map in the bottom image.

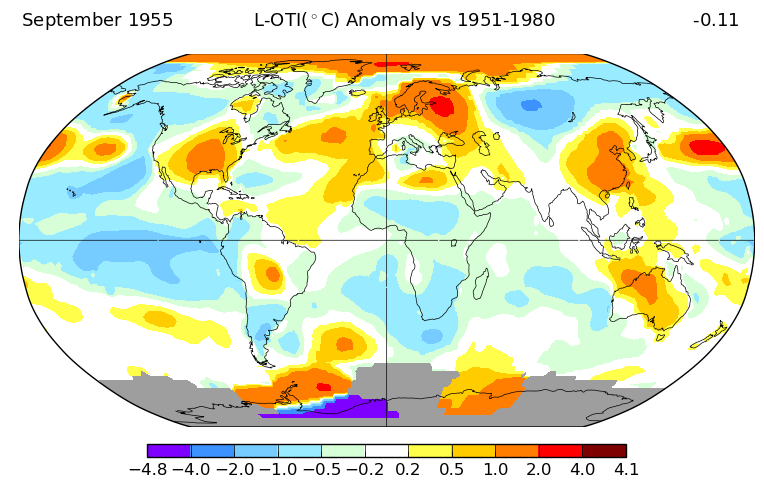
Those were water temperatures, now let’s talk air temperatures. The next 3 maps are: September 2021, September 1985 and September 1955.

The “base state” of the atmospheric and oceanic systems are so much warmer now. Some La NIna’s these days are WARMER than strong El Nino’s were before. That throws a real monkey wrench into the forecasting process.

A partial solution: I have stopped using any analog years prior to 1995. It’s an arbitrary number, yes, but that’s where my process is right now. In future years maybe I’ll only go back to 2000.

Q: If the forecast doesn’t go well, will you admit it?

A: Yes! I always do. You HAVE to be humble in this profession. I believe you have to be transparent too. I want you to get your weather forecasts from me and our team, not some random app. Honesty, reliability, transparency and of course accuracy are (hopefully!) how we achieve that.

See you November 4th!


October 26, 2021 /Eric Wilhelm
  • Newer
  • Older

Powered by Squarespace