Winter 2024-2025 Forecast: More Of The Same?
Winter? What Winter??
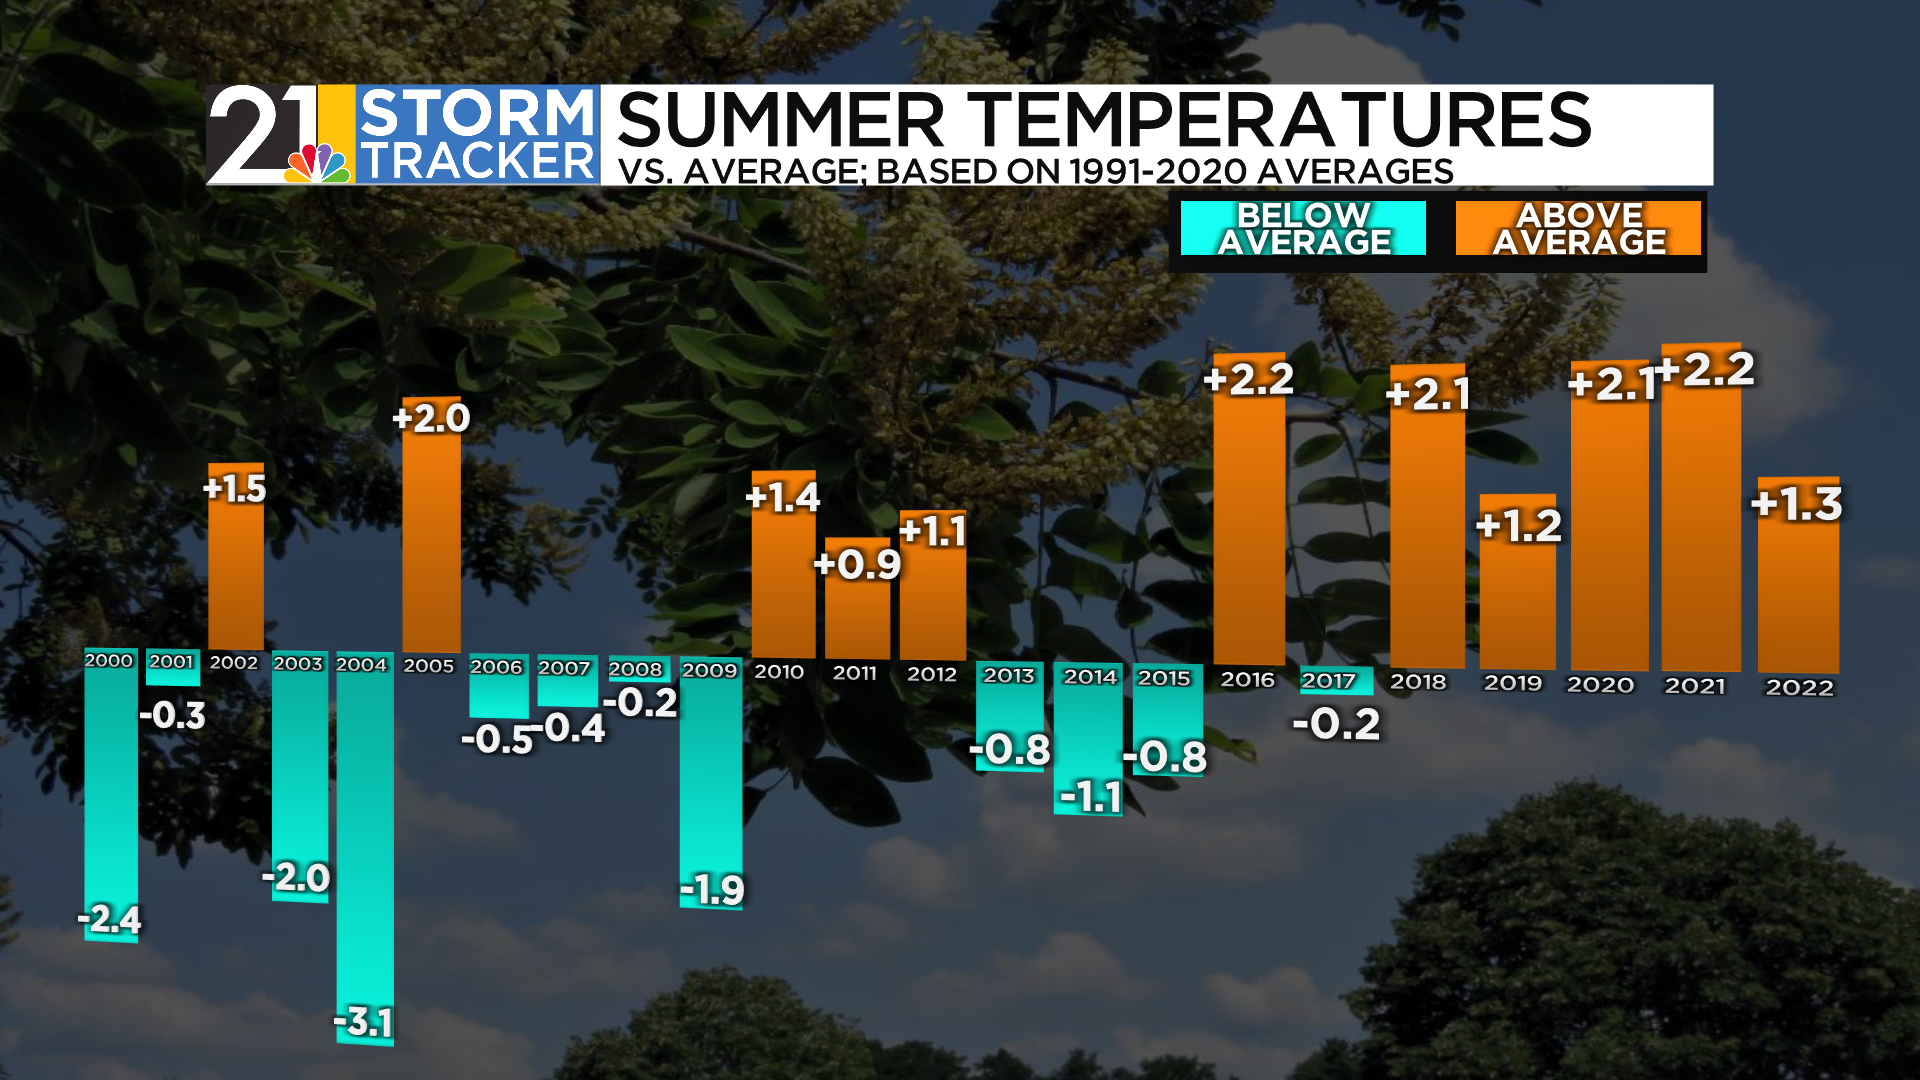
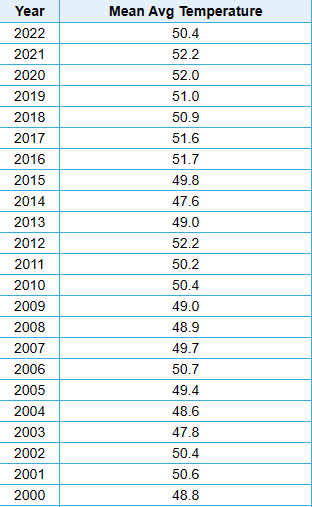
Eastern Ohio and western Pennsylvania has not seen a “hard” winter in a decade at this point. The last couple of winter seasons have been particularly balmy; winter 2023-24 was the warmest since the all-time warmest winter season in 1931-32.


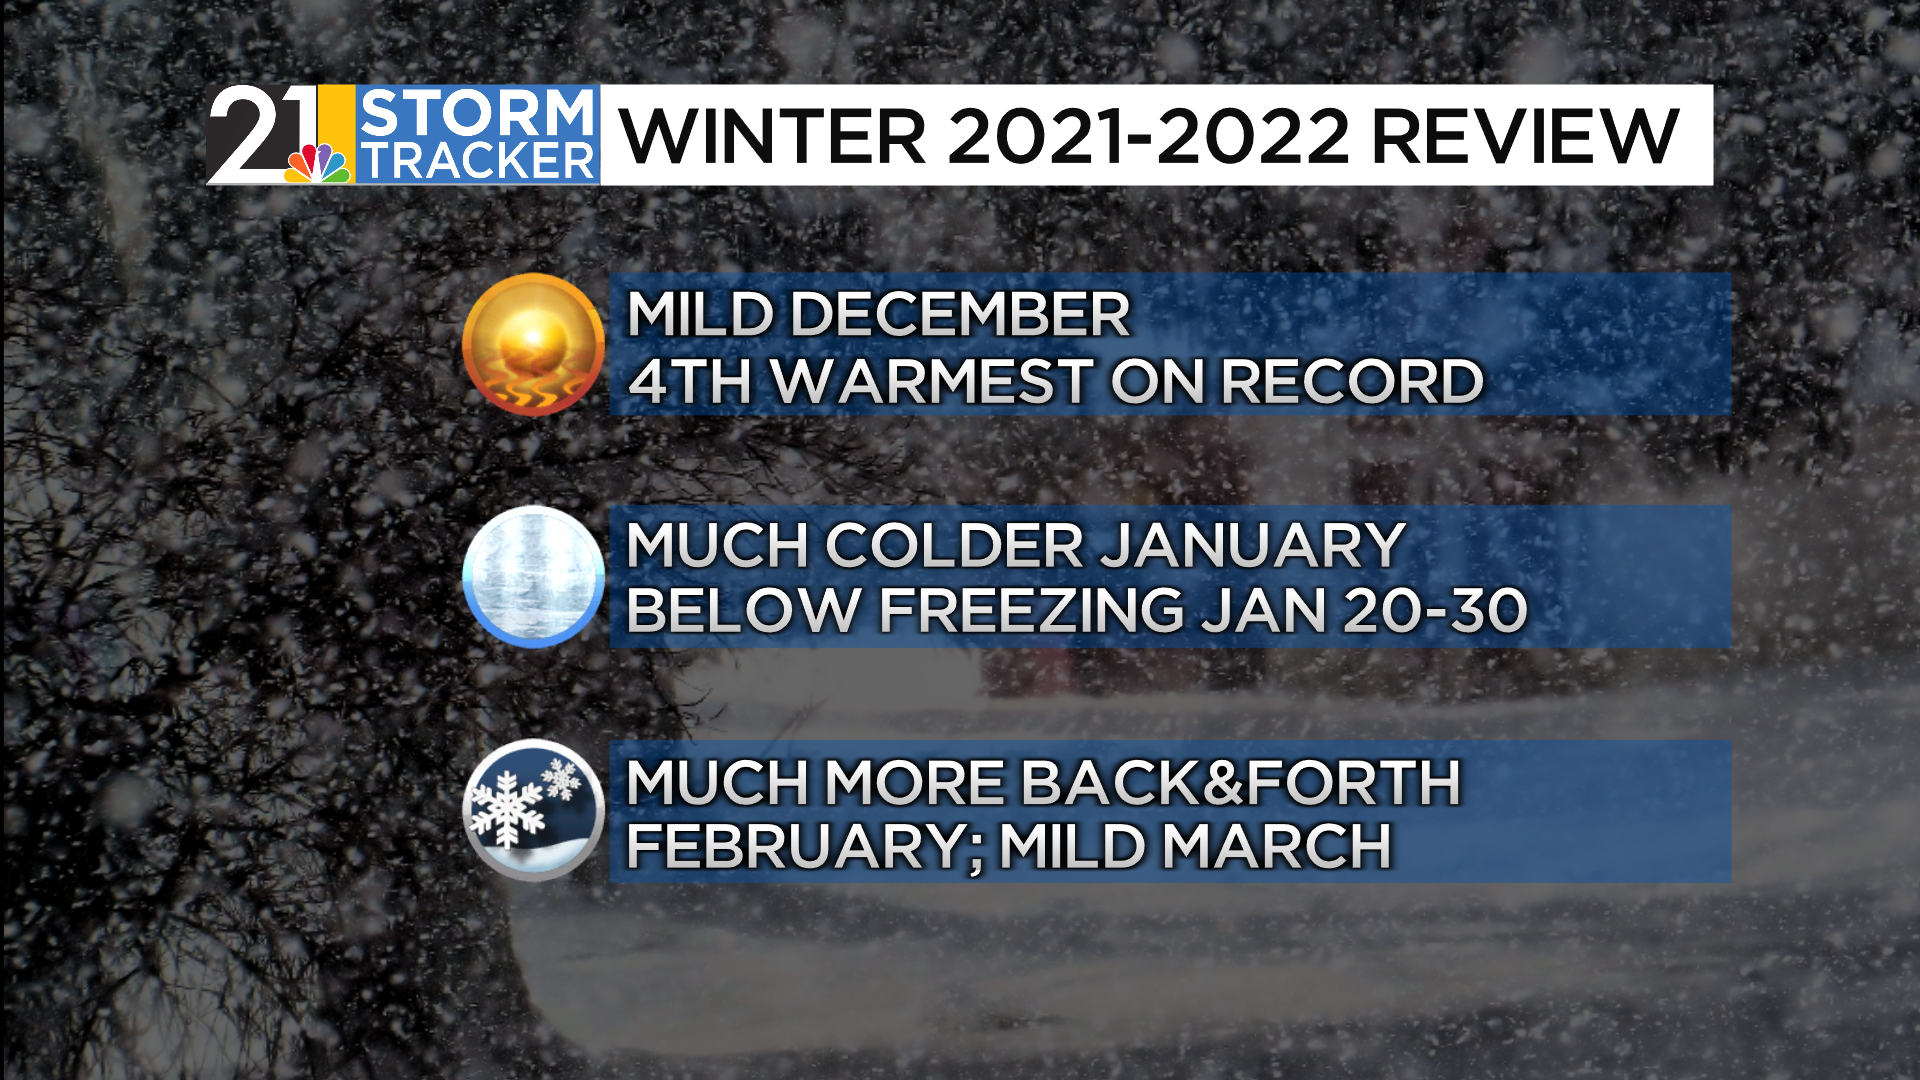
While our forecast for last winter was certainly not a cold one, it did not capture the MAGNITUDE of the warmth and lack of snow. The previous winter was very warm and we expected winter 22-23 to be “less warm”. The atmosphere had other ideas.


It really was only cold for ONE stretch last winter…right in the middle of January.

Looking Ahead To This Winter
Will winter remain missing in action again this time around? Will snow lovers be disappointed once again? Let’s dive into it. First of all, how do we make these forecasts?
ANALOGS
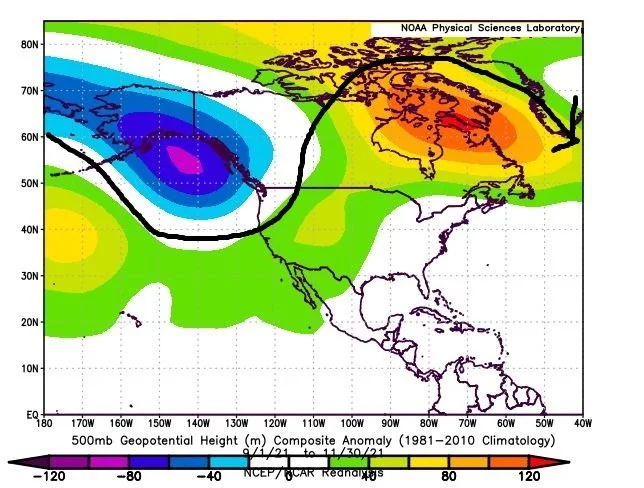
A seasonal forecast is a very different entity than a weather forecast for the next hour, the next day or the next week. To construct a seasonal forecast, we look backward as much as we look forward. Meaning: the past can give us hints about the future. The great thing about being a meteorologist in 2024 is that we have an enormous amount of data at our disposal. Name a date in history and I can figure out what the weather was like not only around our area, but nearly anywhere in the world…all practically within seconds. We can also look at historical ocean water temperatures…..which are a big key to a winter forecast.

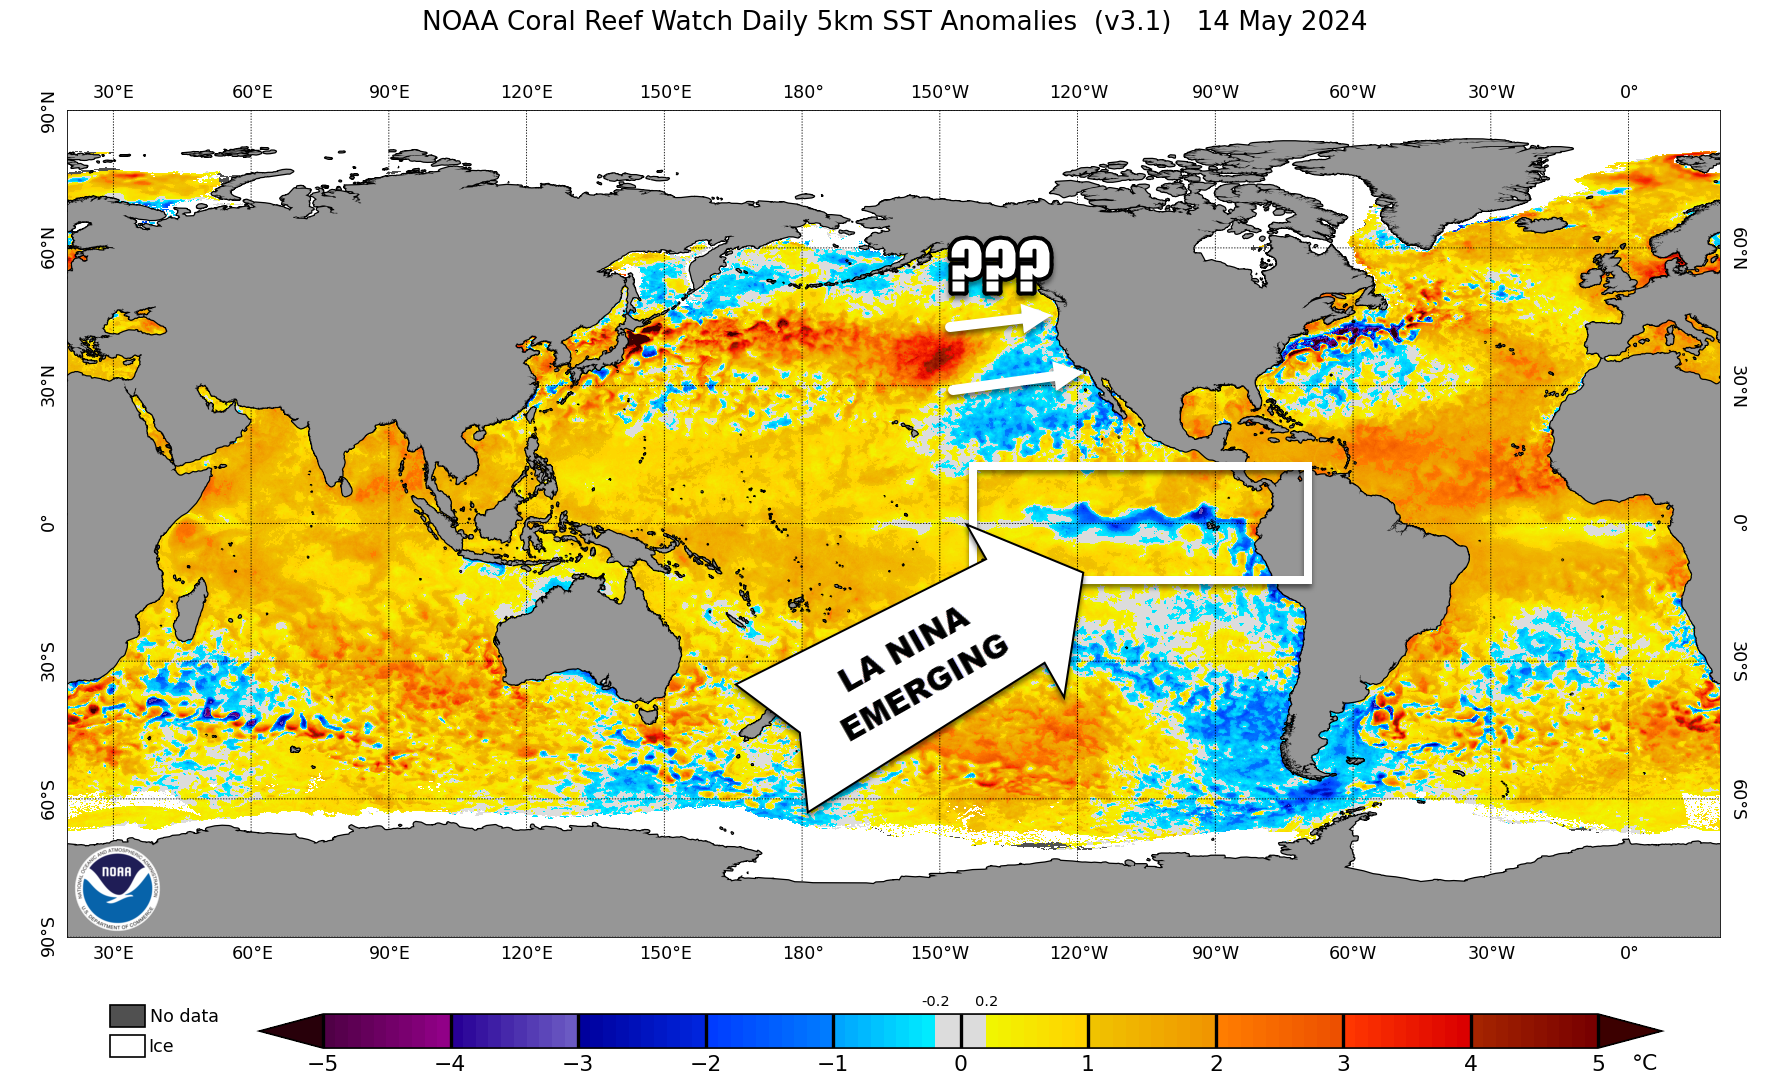
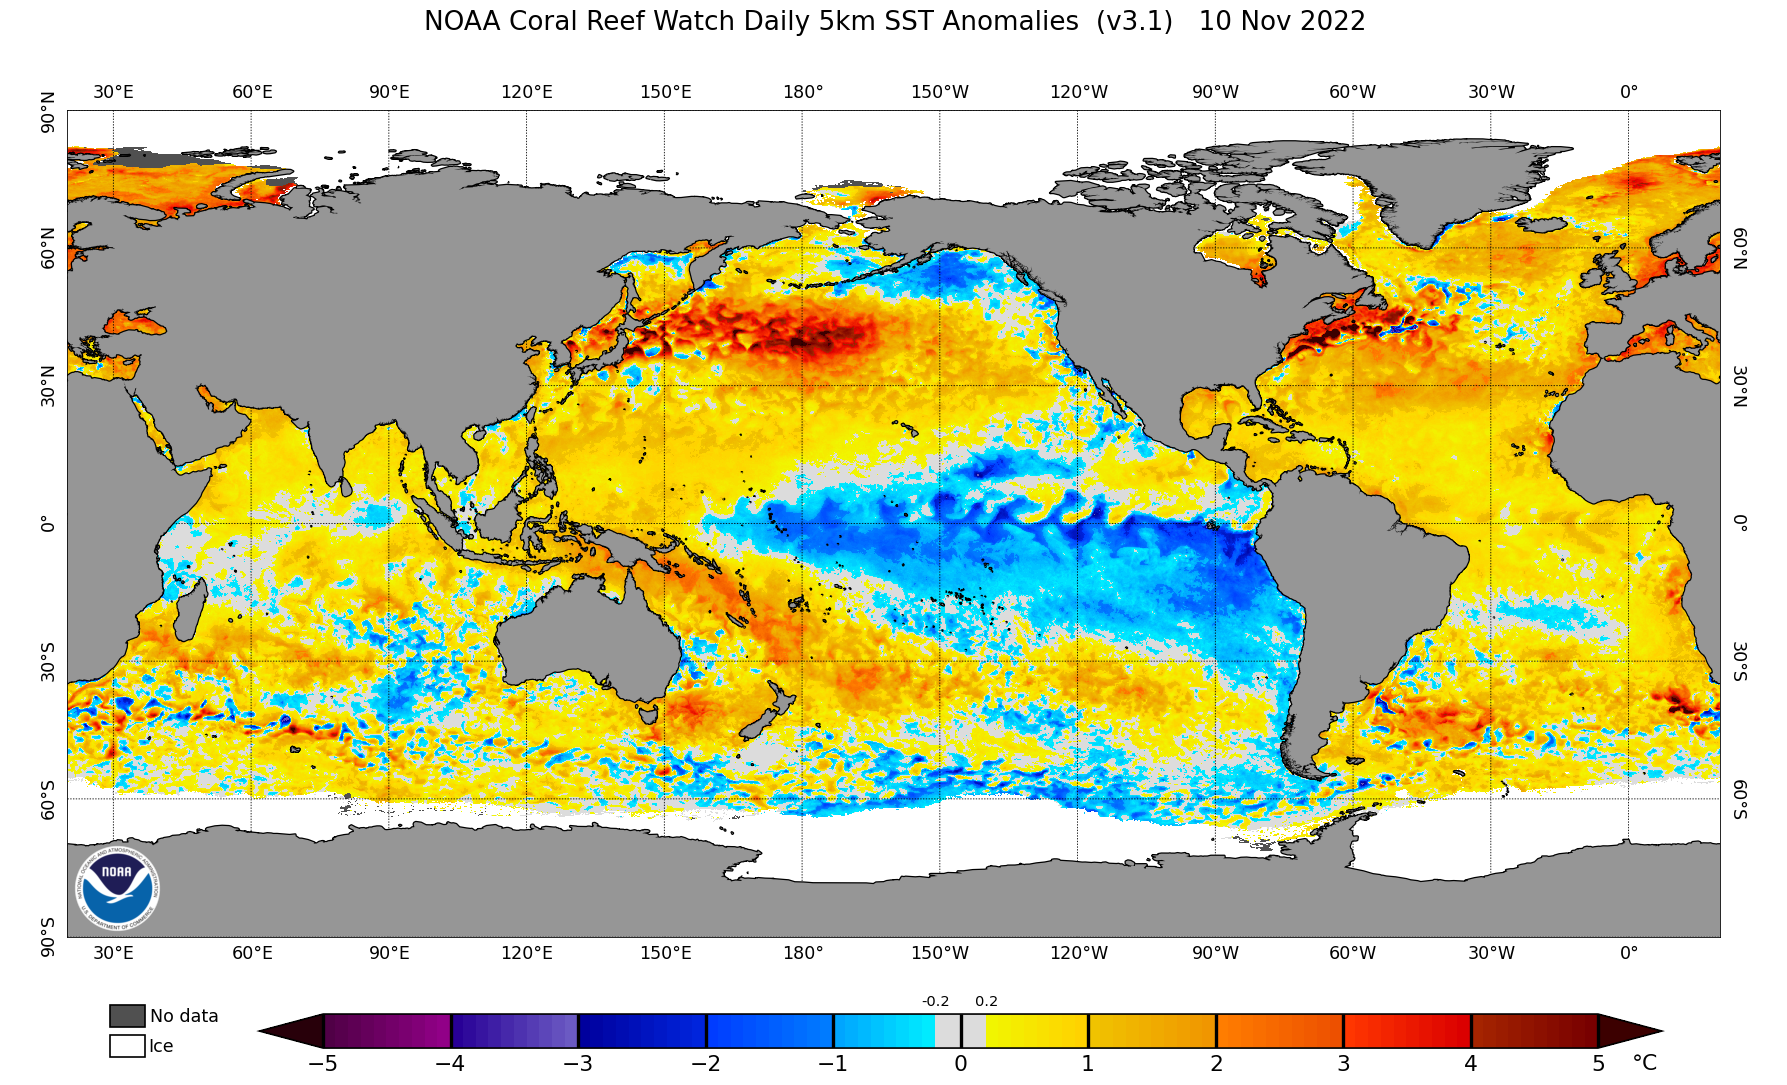
The image above shows water temperatures vs. average across the world as of November 6th. I’ve highlighted 2 areas in the Pacific:
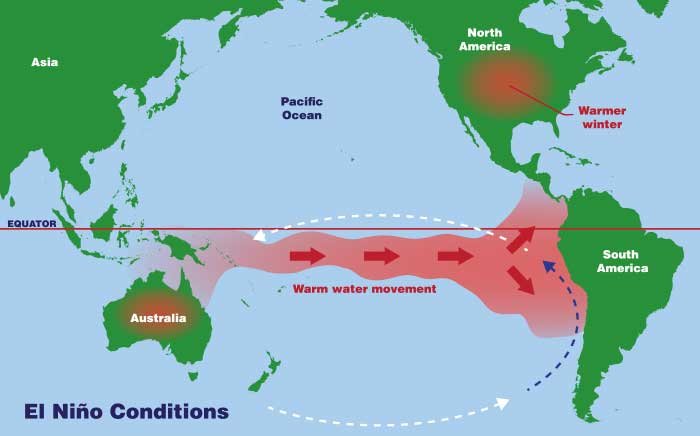
1) An emerging “La Nina” (the blue colors)
2) An area of very warm water in the northwest Pacific (the red colors)
These two features are likely to have an influence on weather patterns in the Northern Hemisphere this winter…one perhaps quite a bit more than the other.
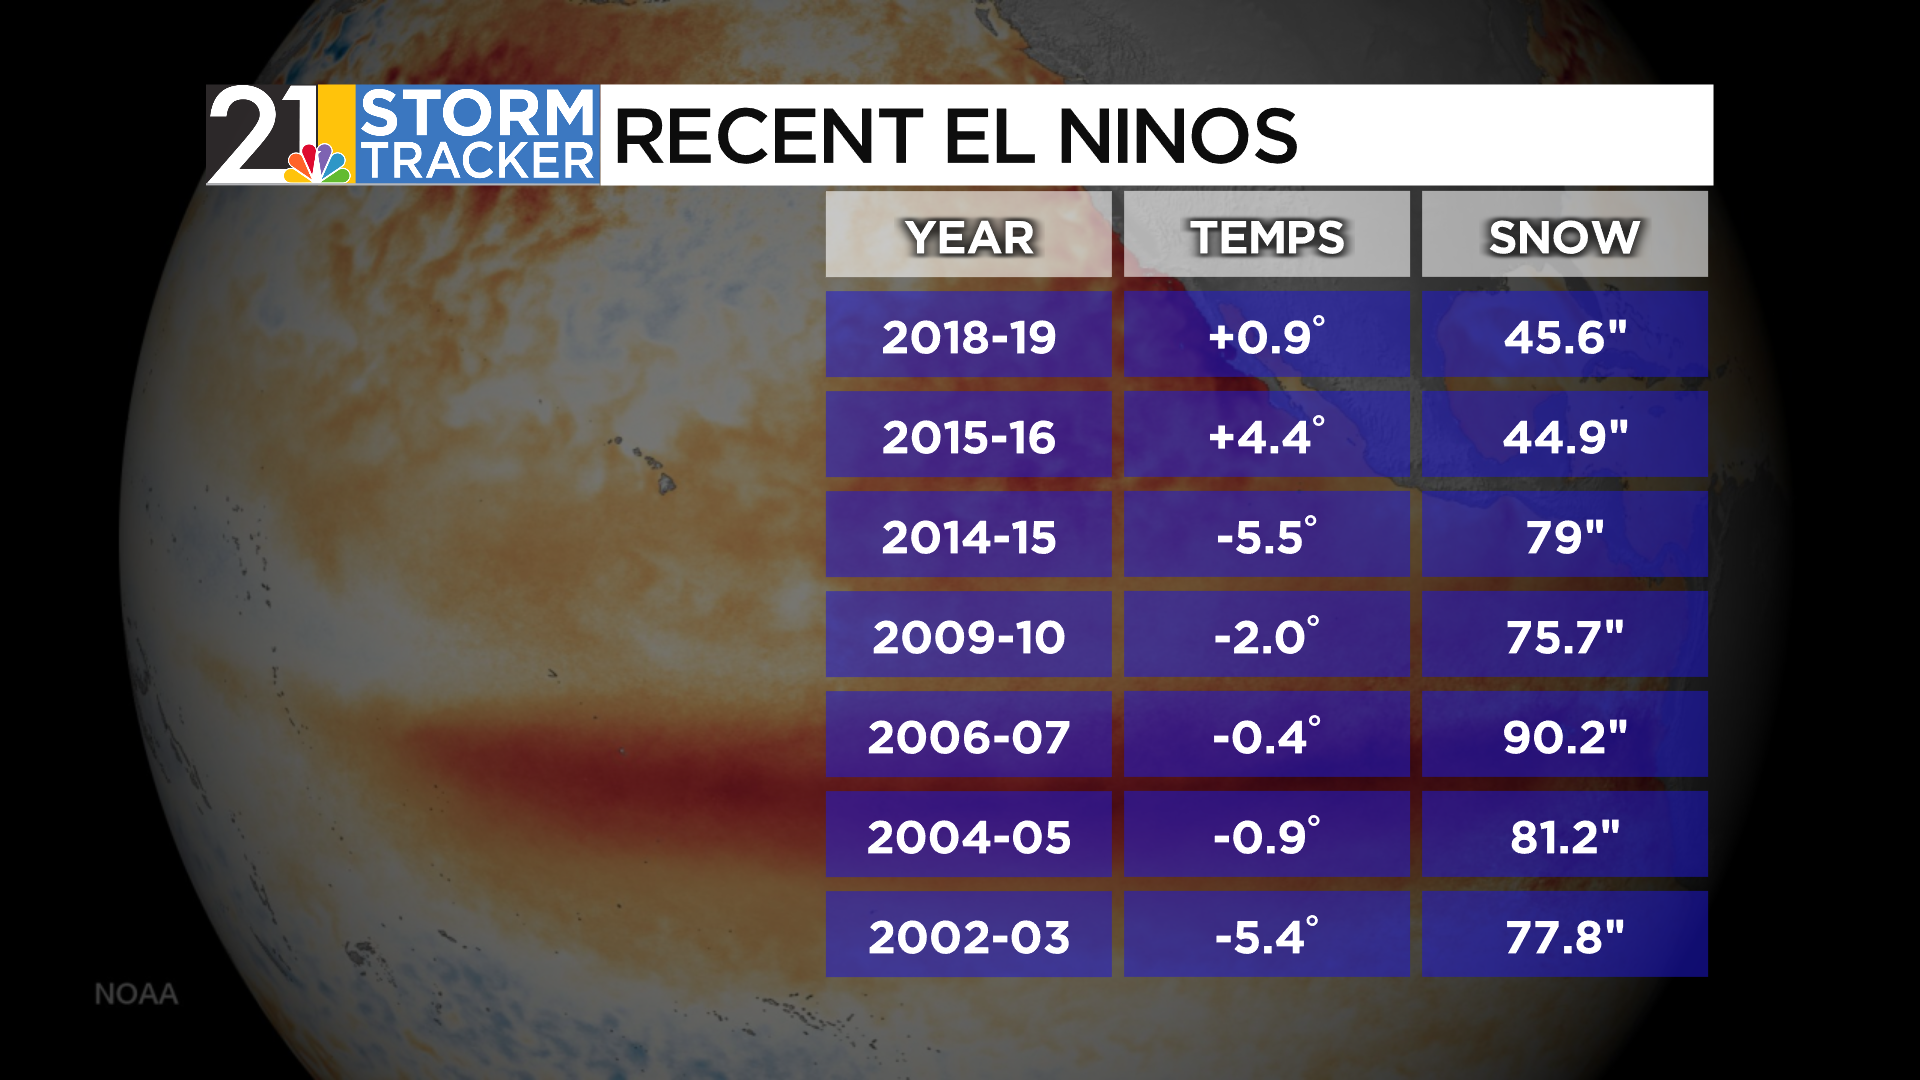
So, when trying to “analog” the upcoming winter, we look for La Ninas (preferably weaker ones) and ones that had that northern Pacific signature, known as the negative phase of the “Pacific Decadal Oscillation” or “PDO”. The PDO is VERY negative and has been for a couple of years now.
I think the PDO is actually a bigger deal than the fairly weak La Nina this year.
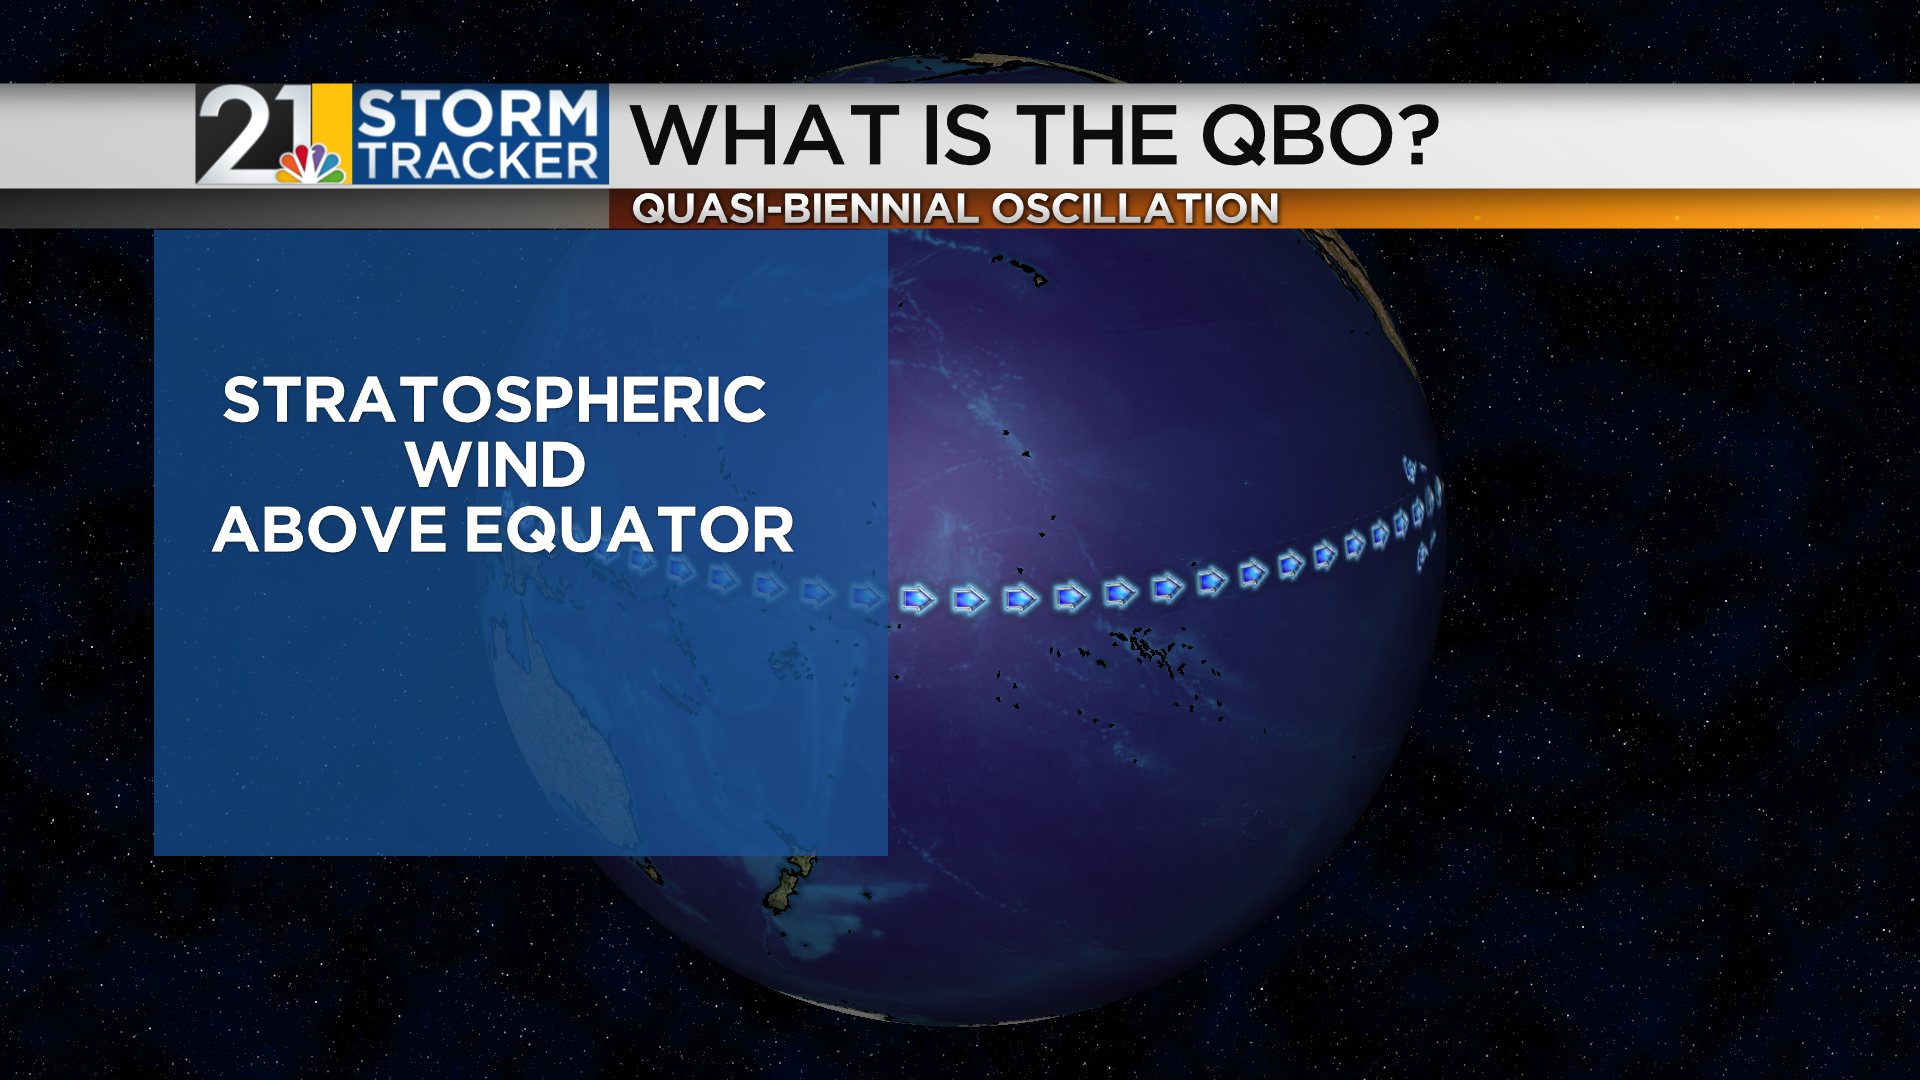
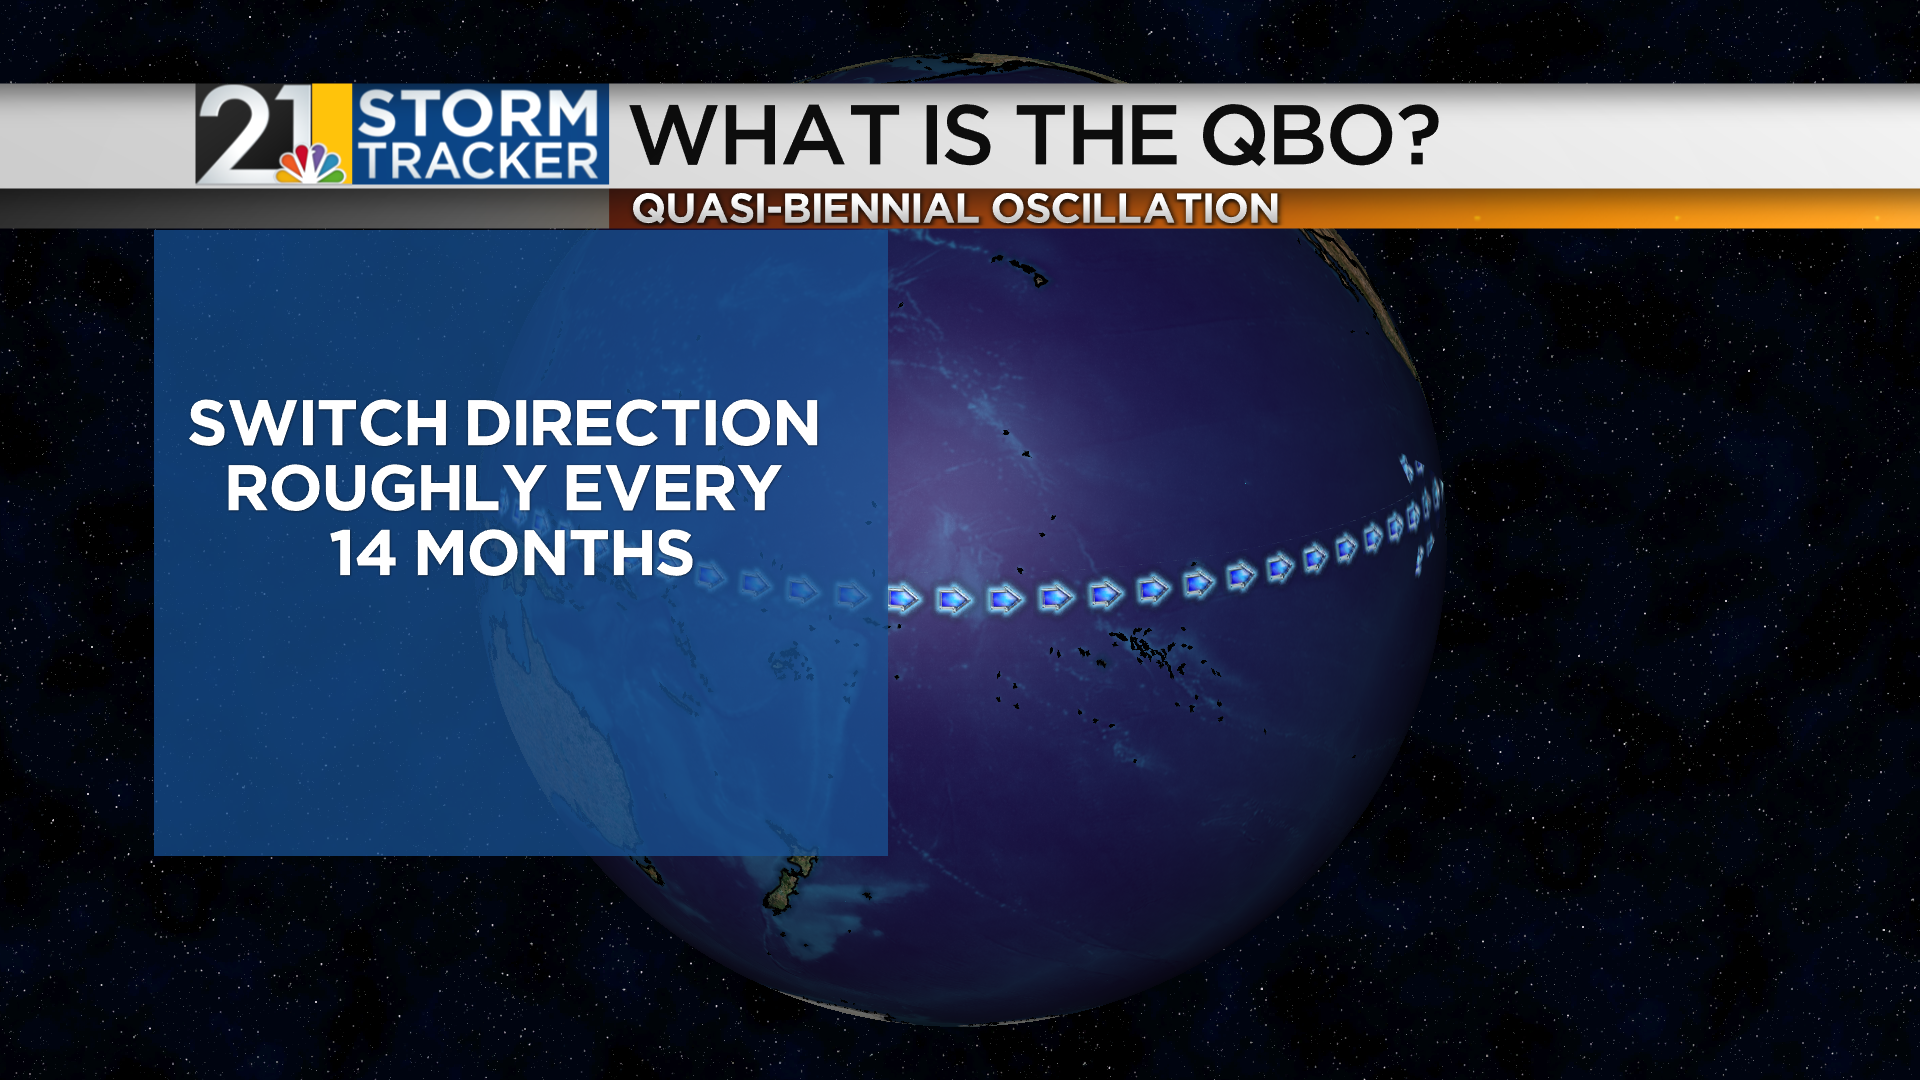
In addition to the La Nina and PDO, we need to look at ocean temperatures elsewhere in the world along with things going on in the stratosphere and even outer space! Specifically, where we are in the “solar cycle”.
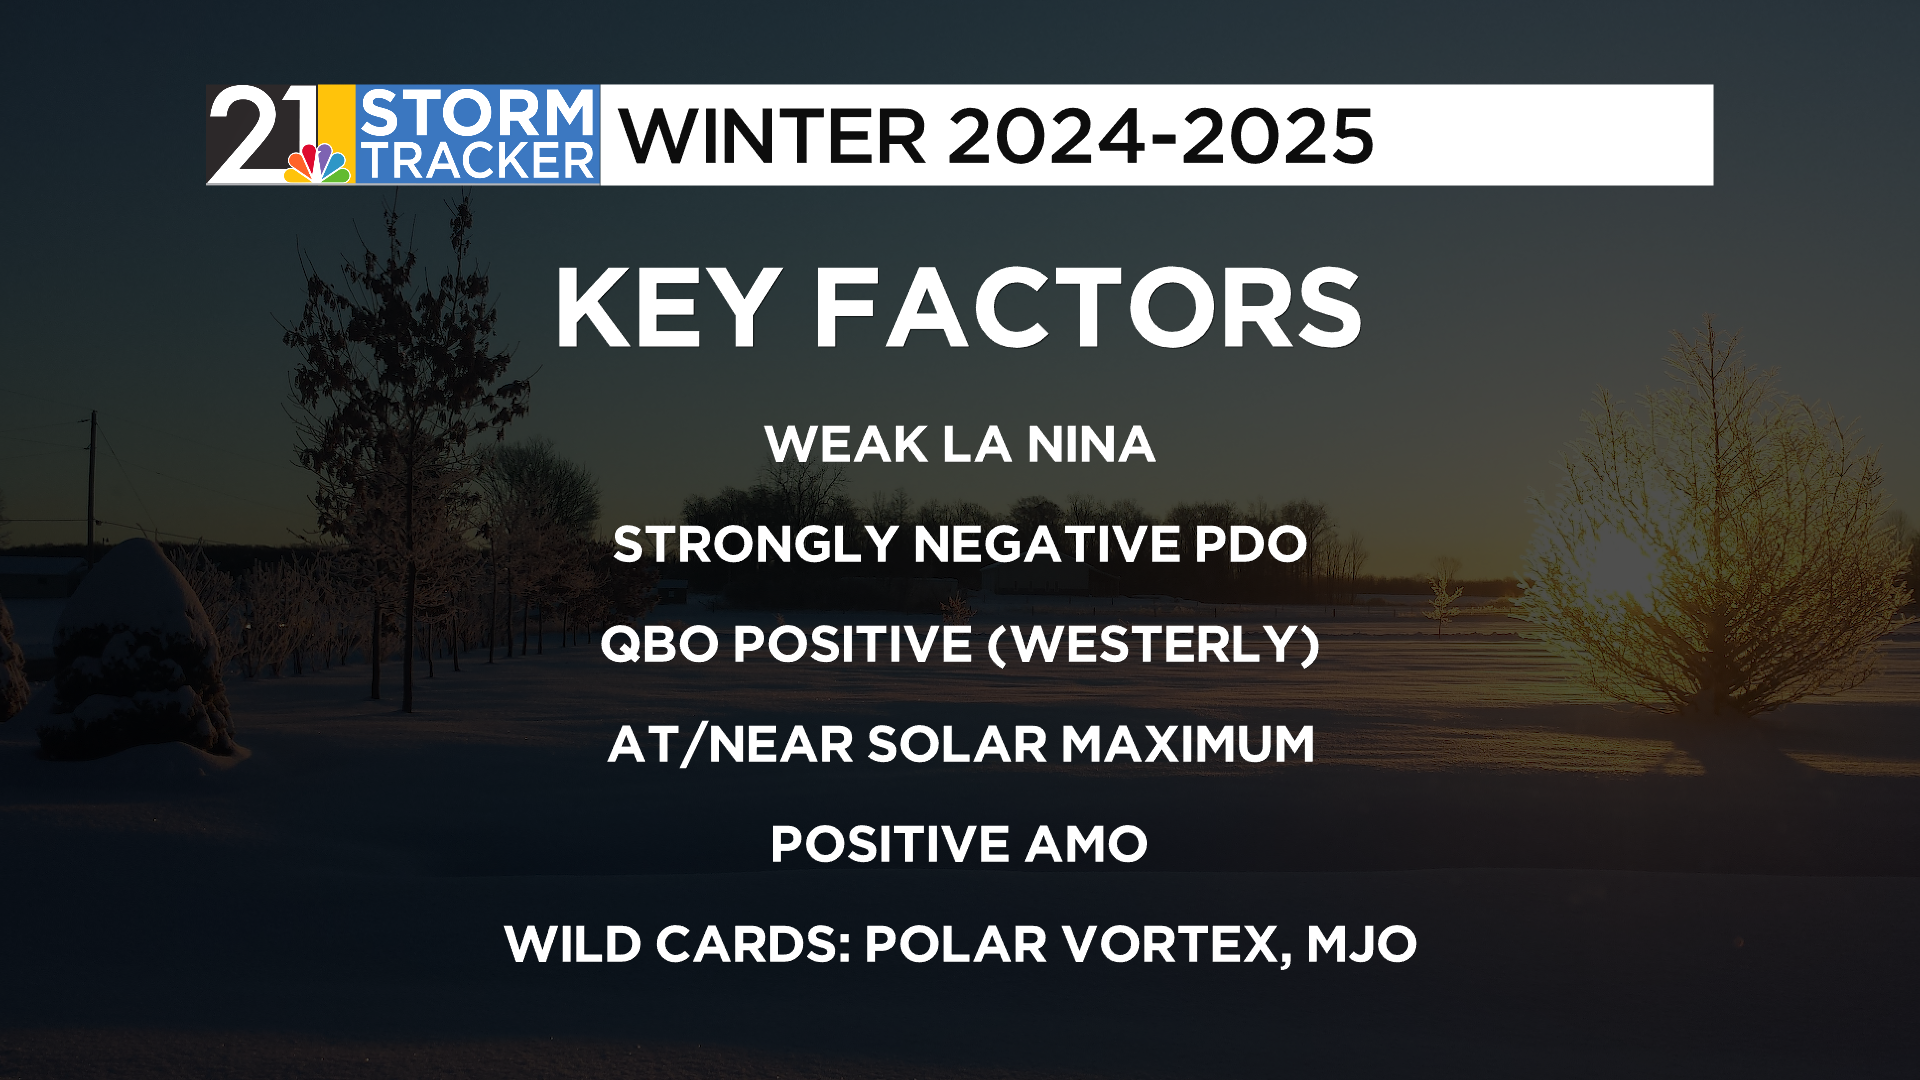
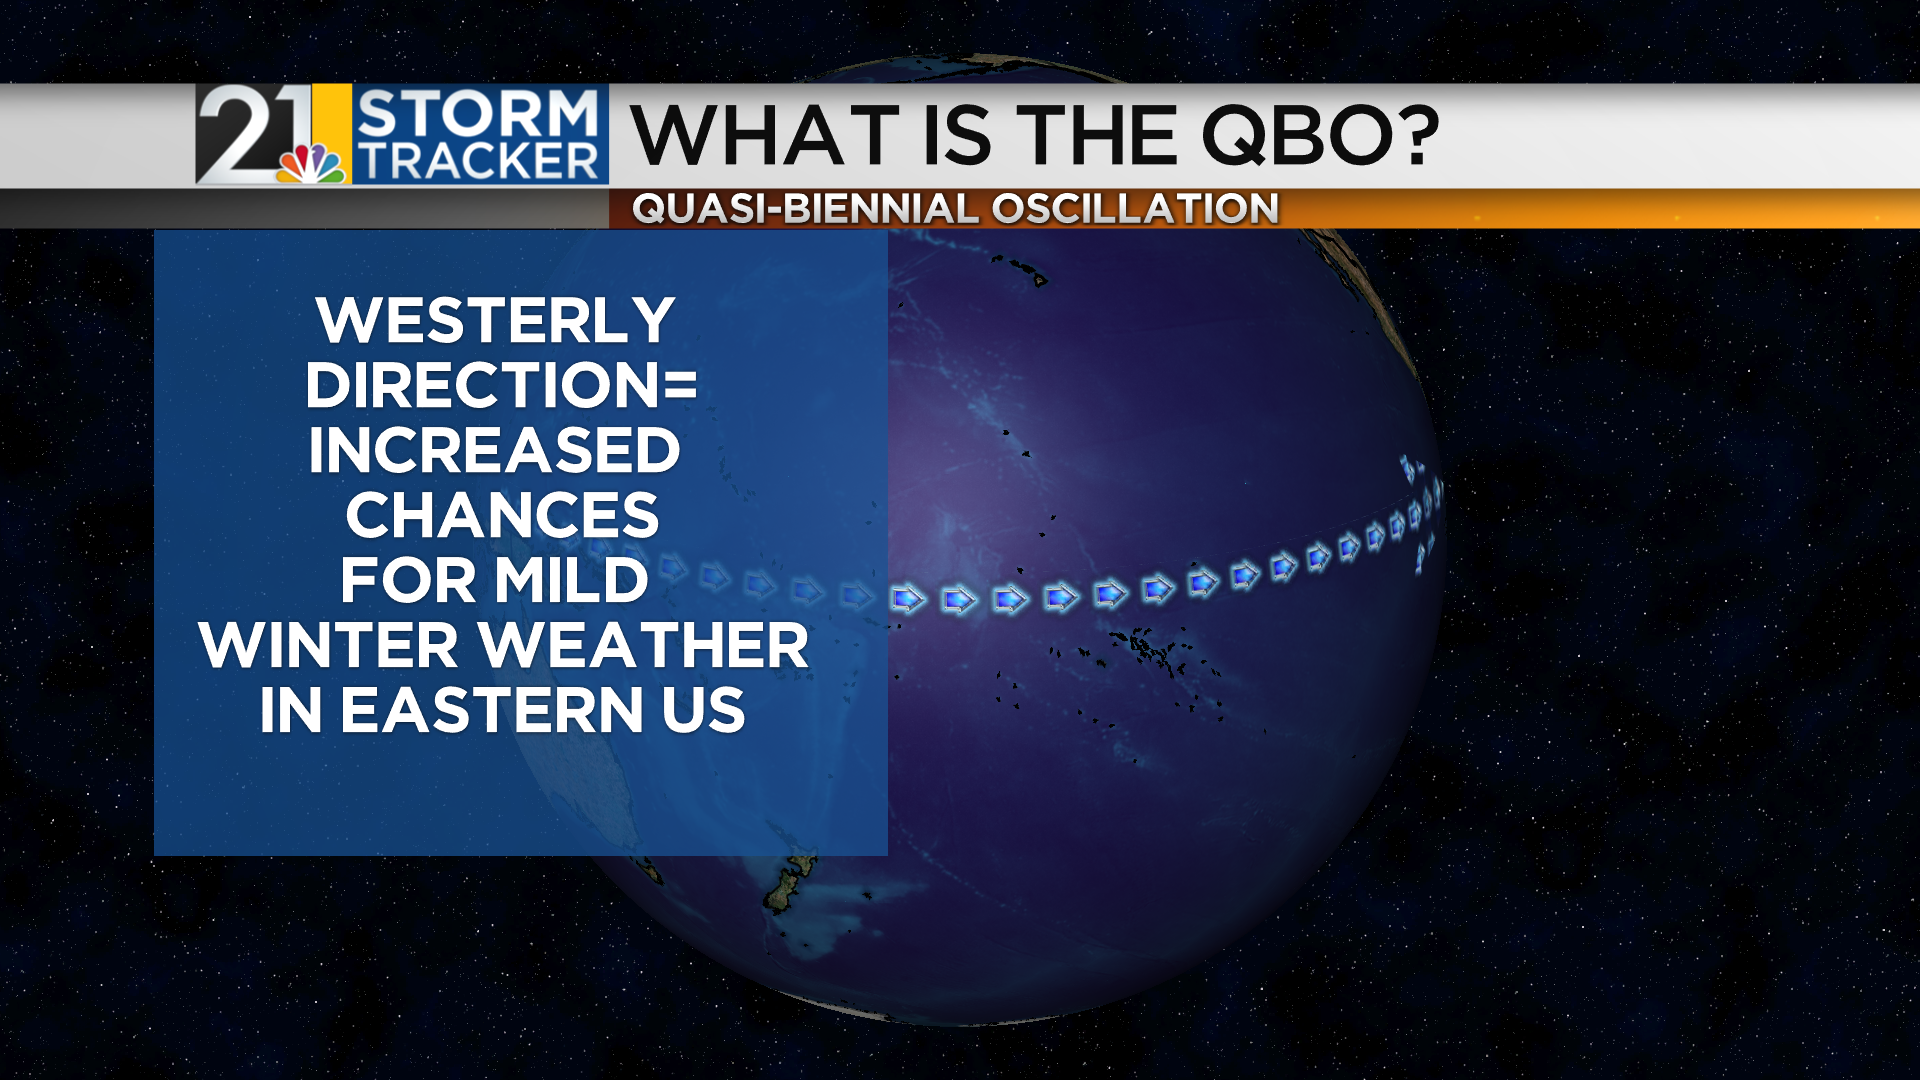
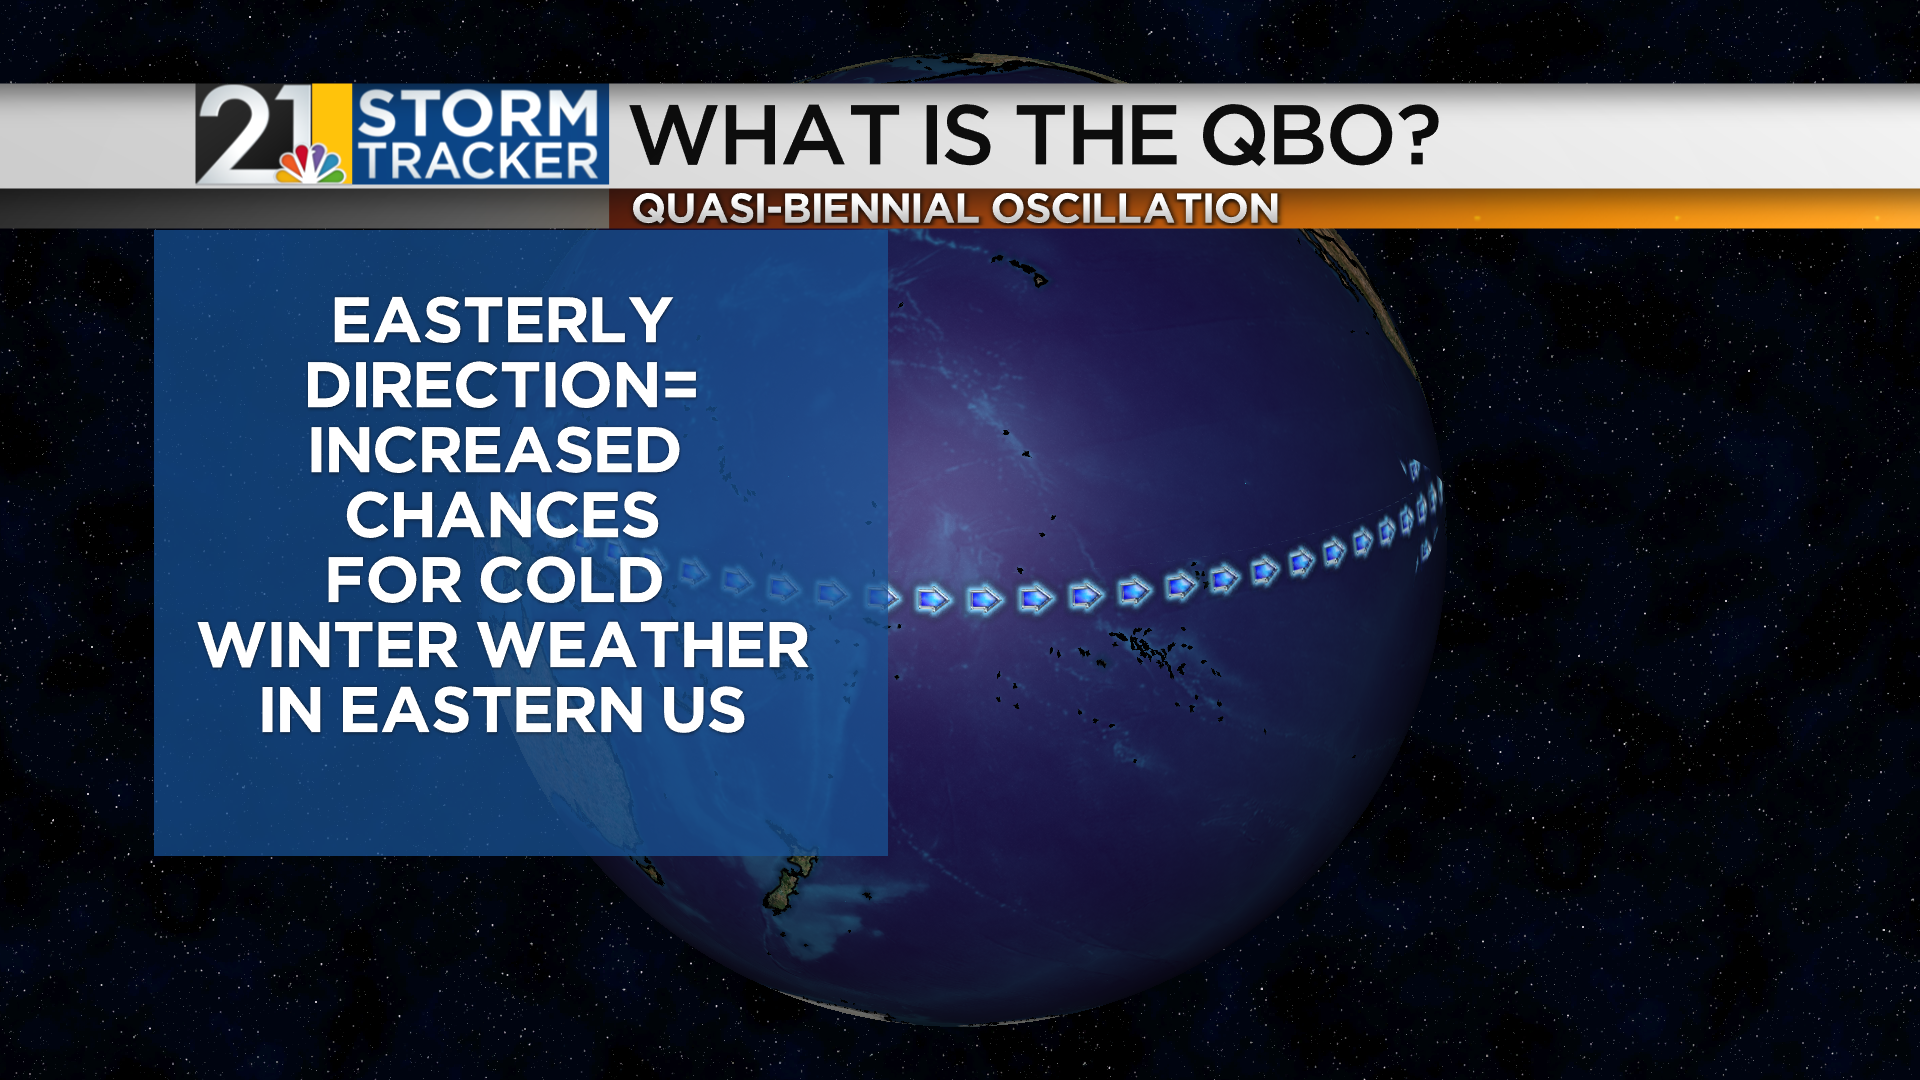
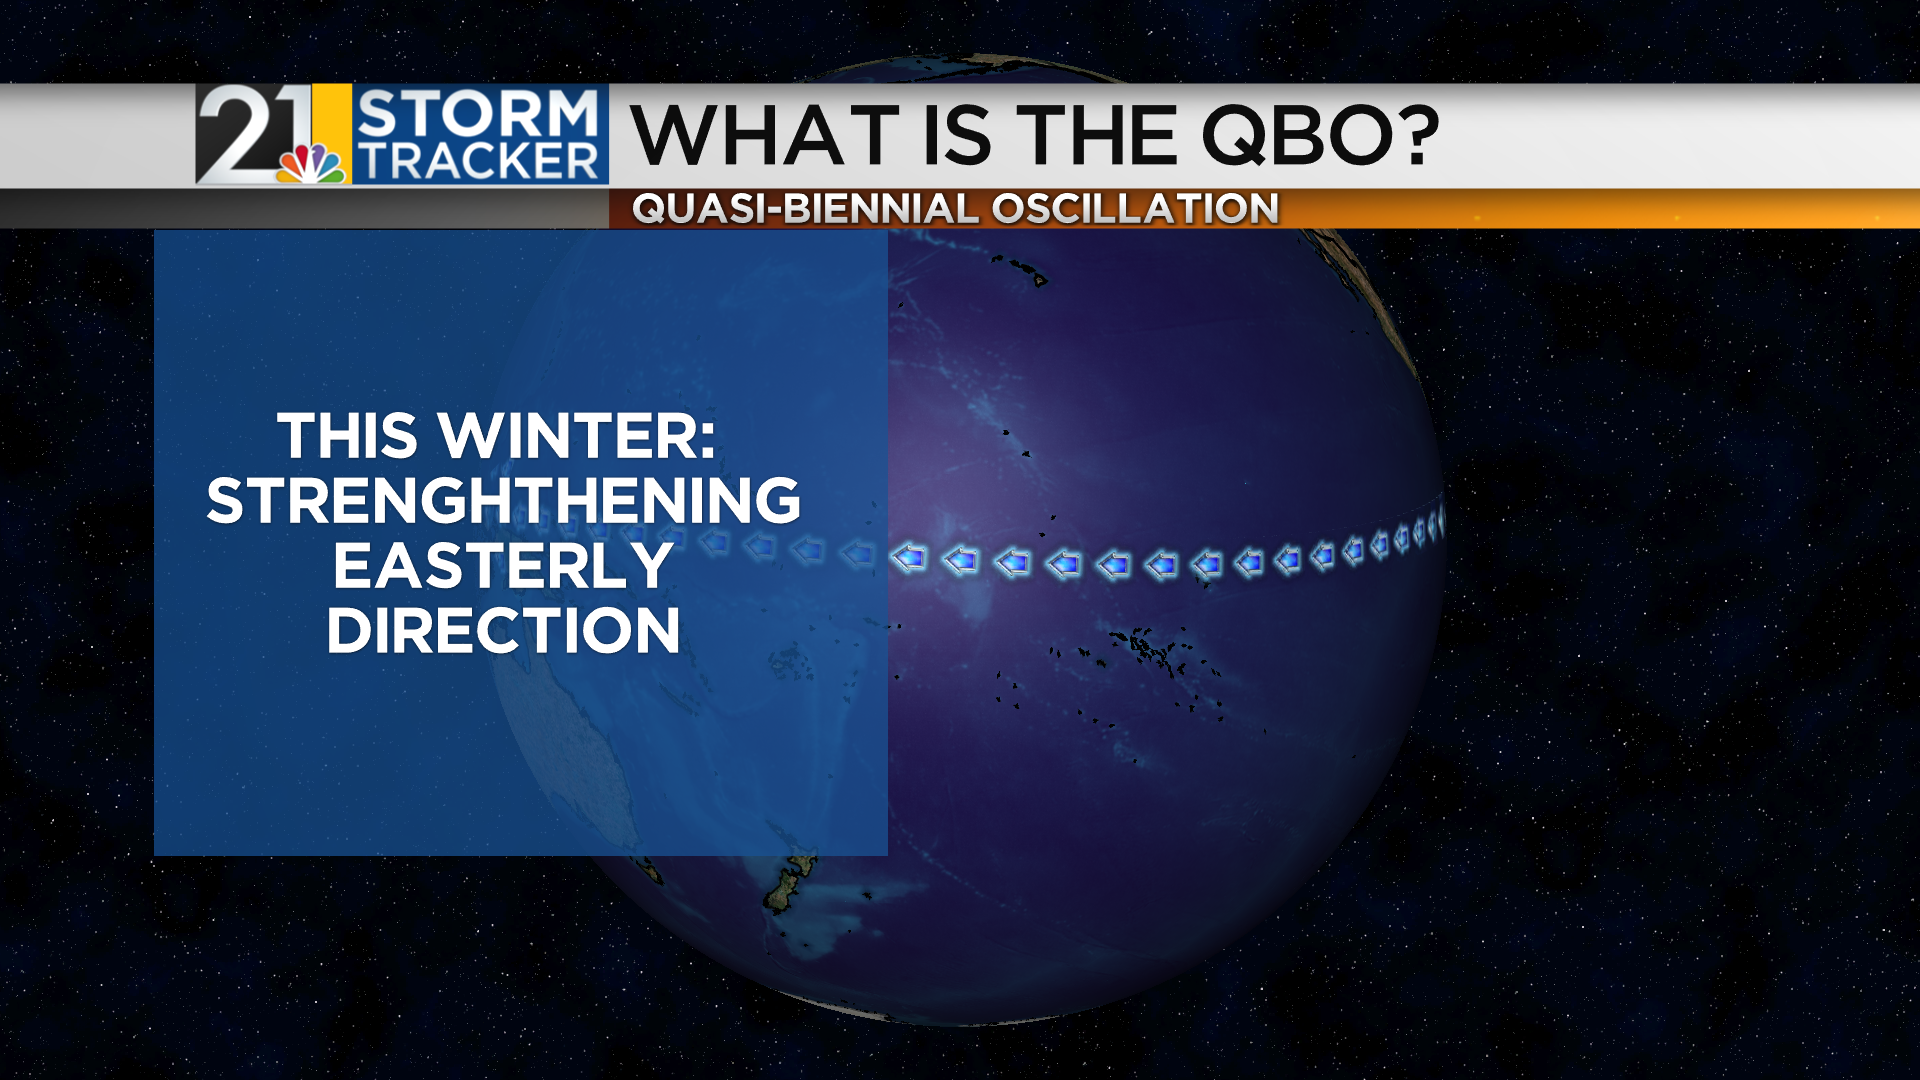
I won’t get too far into the weeds here, but a westerly “QBO”, which has to do with a belt of VERY high altitude winds in the stratosphere, along with the sun being near it’s “maximum” in it’s 11-year sunspot cycle….can decrease the odds of the polar vortex meandering too far off the North Pole. Hence, the cold air tends to stay bottled up way up there.

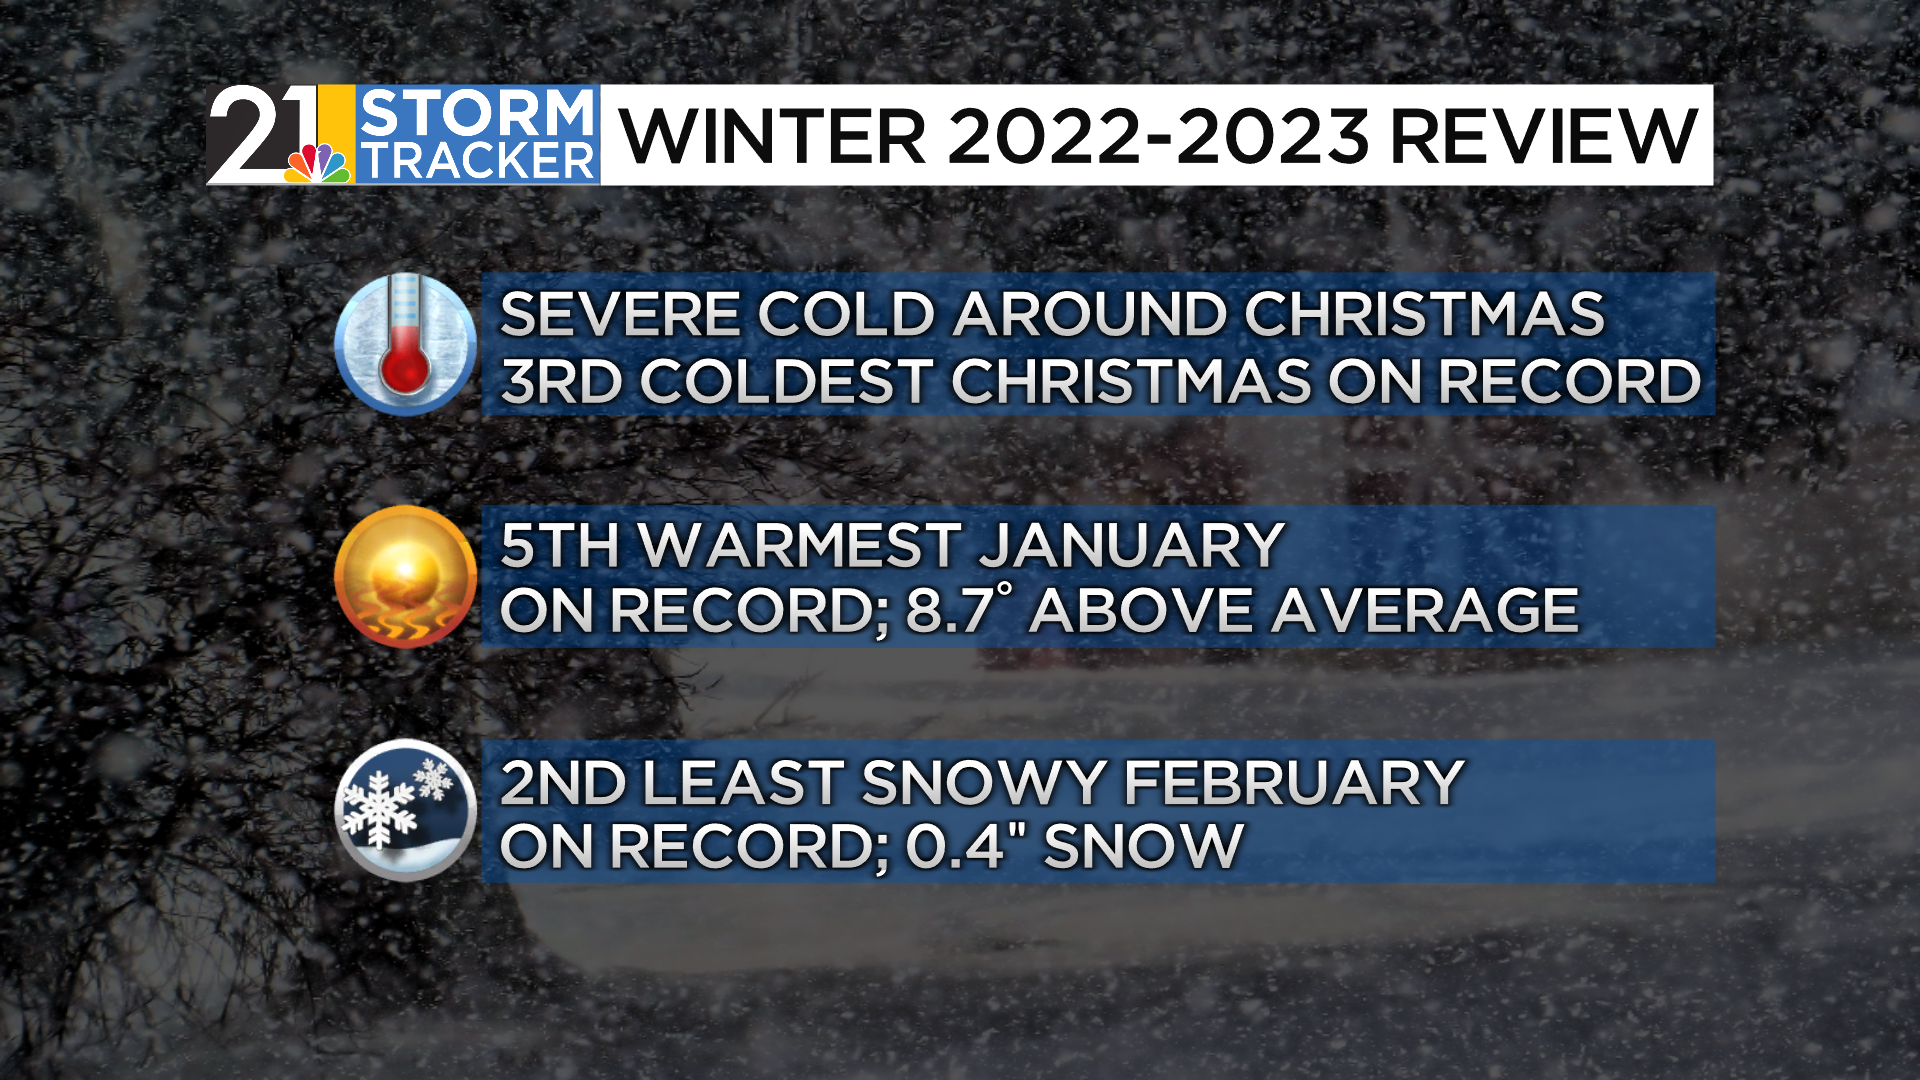
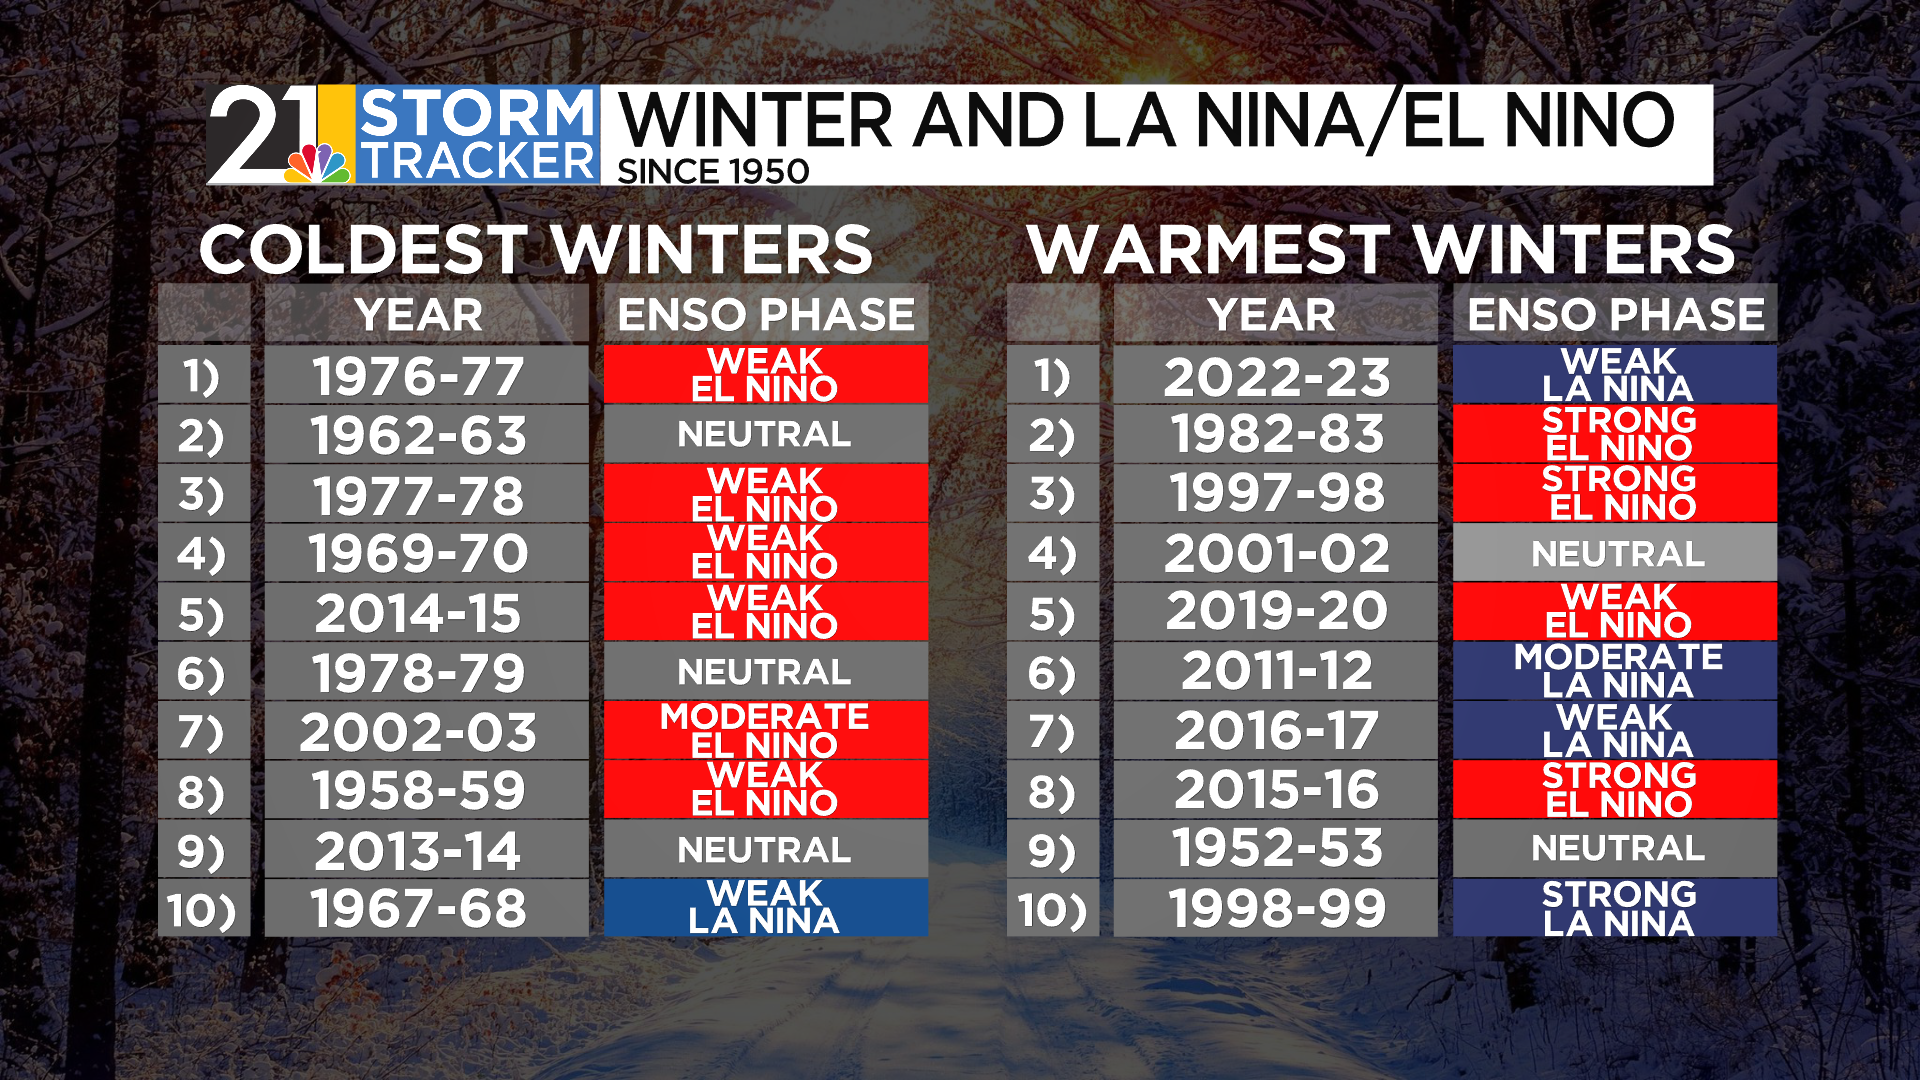
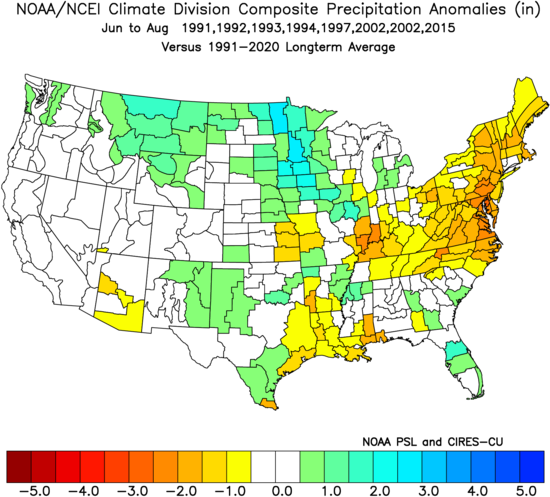
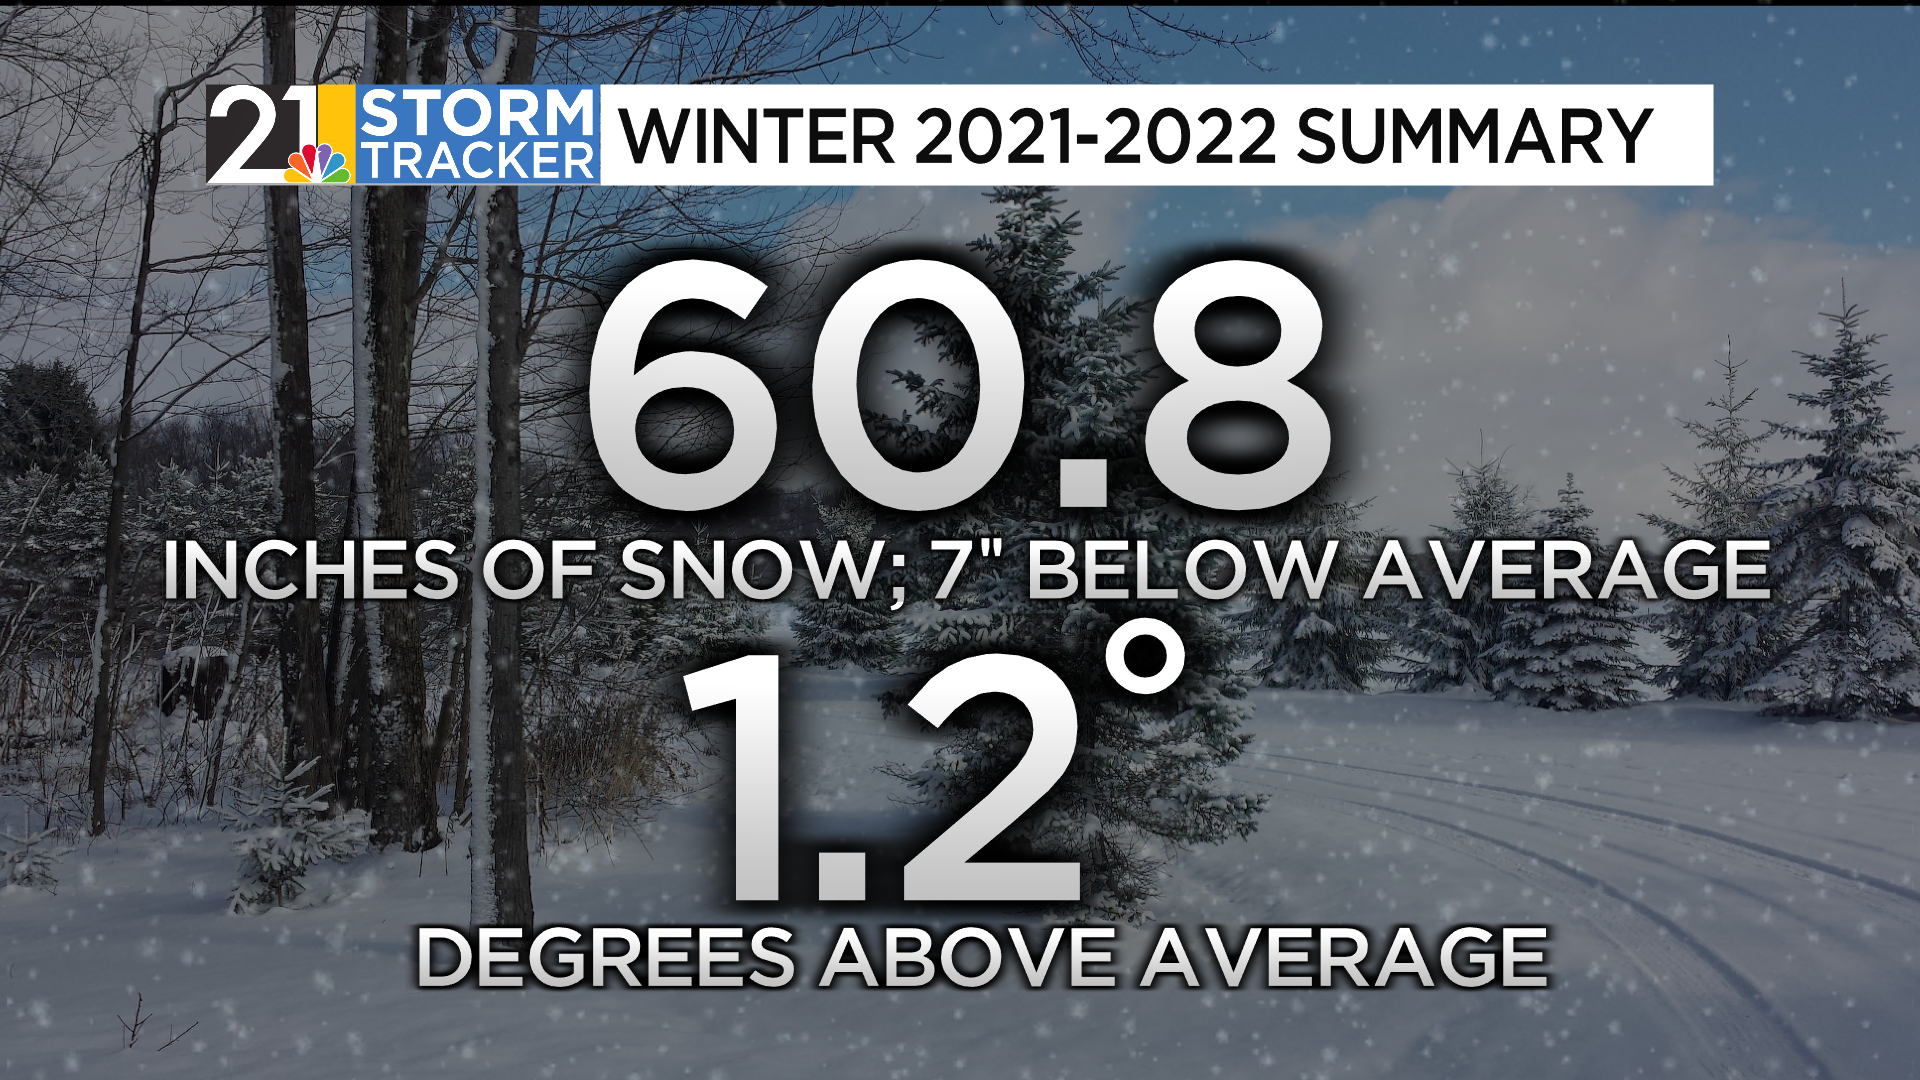
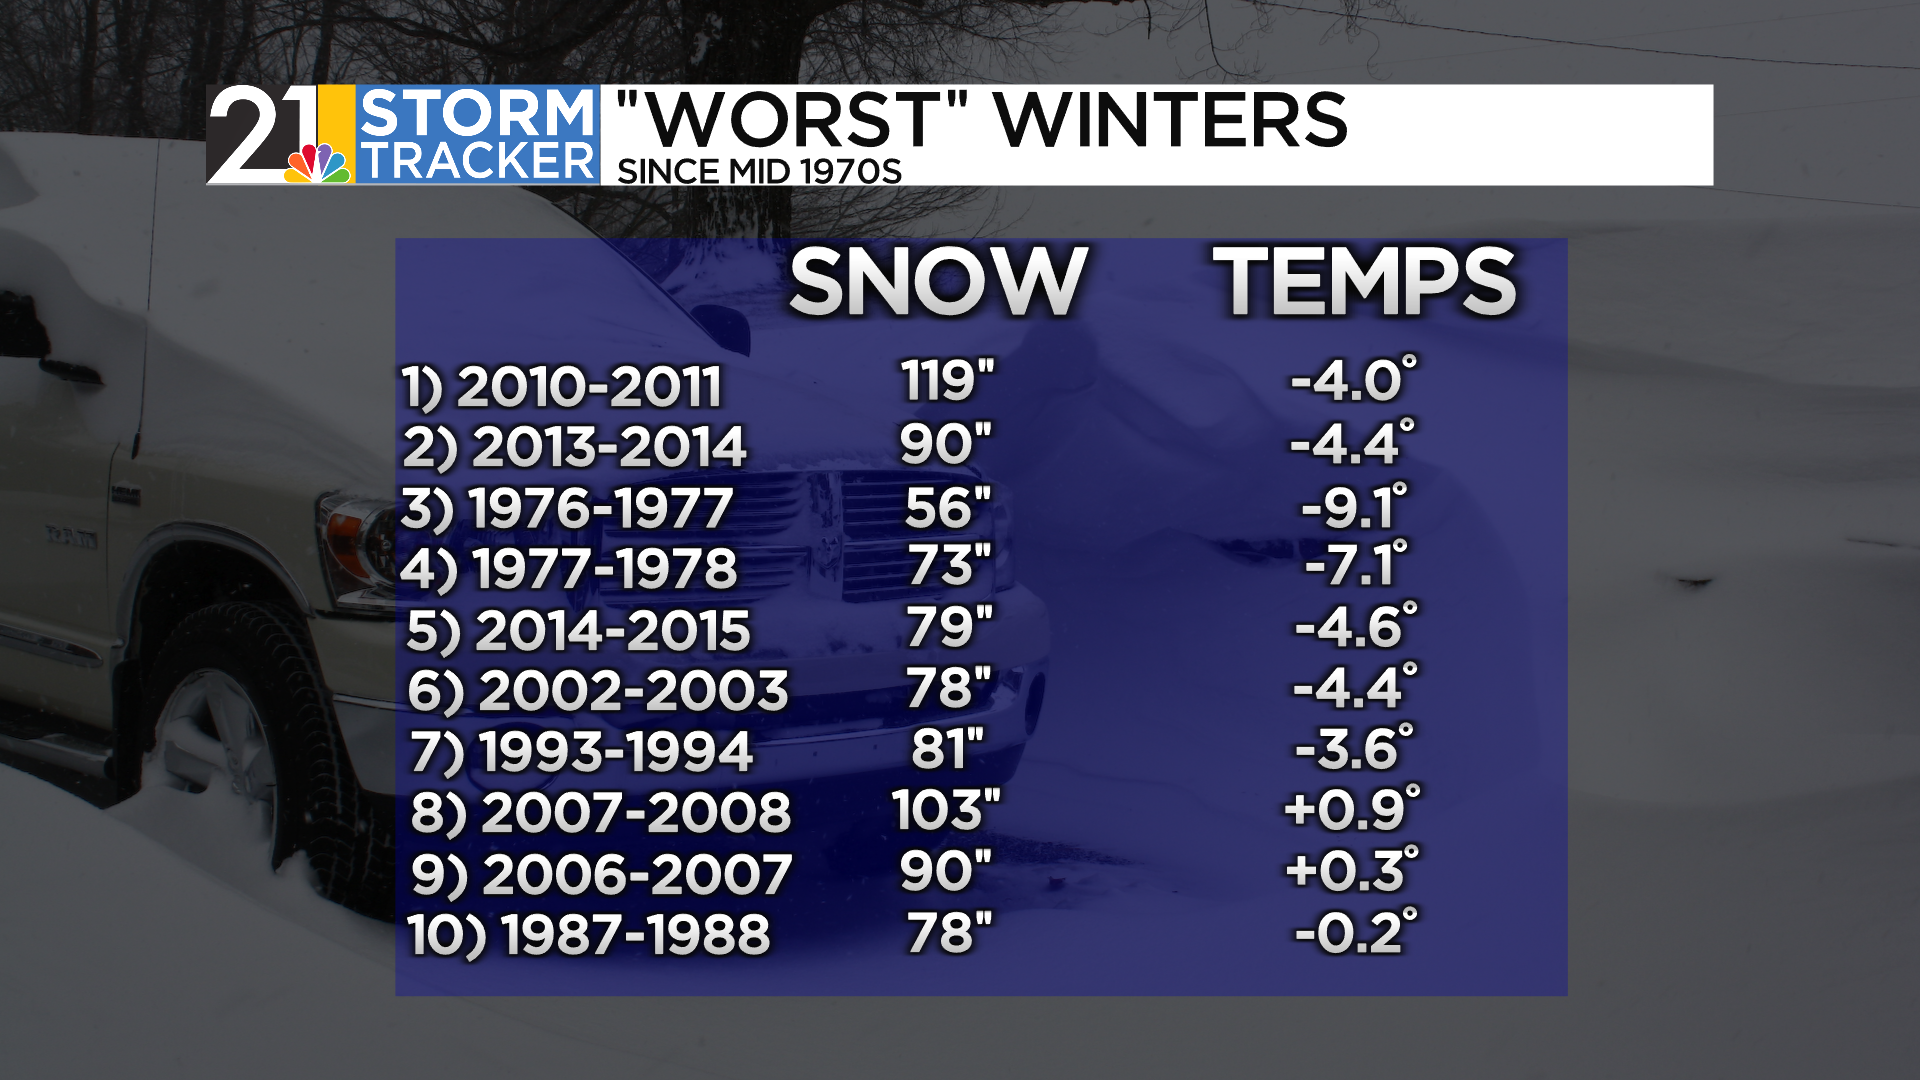
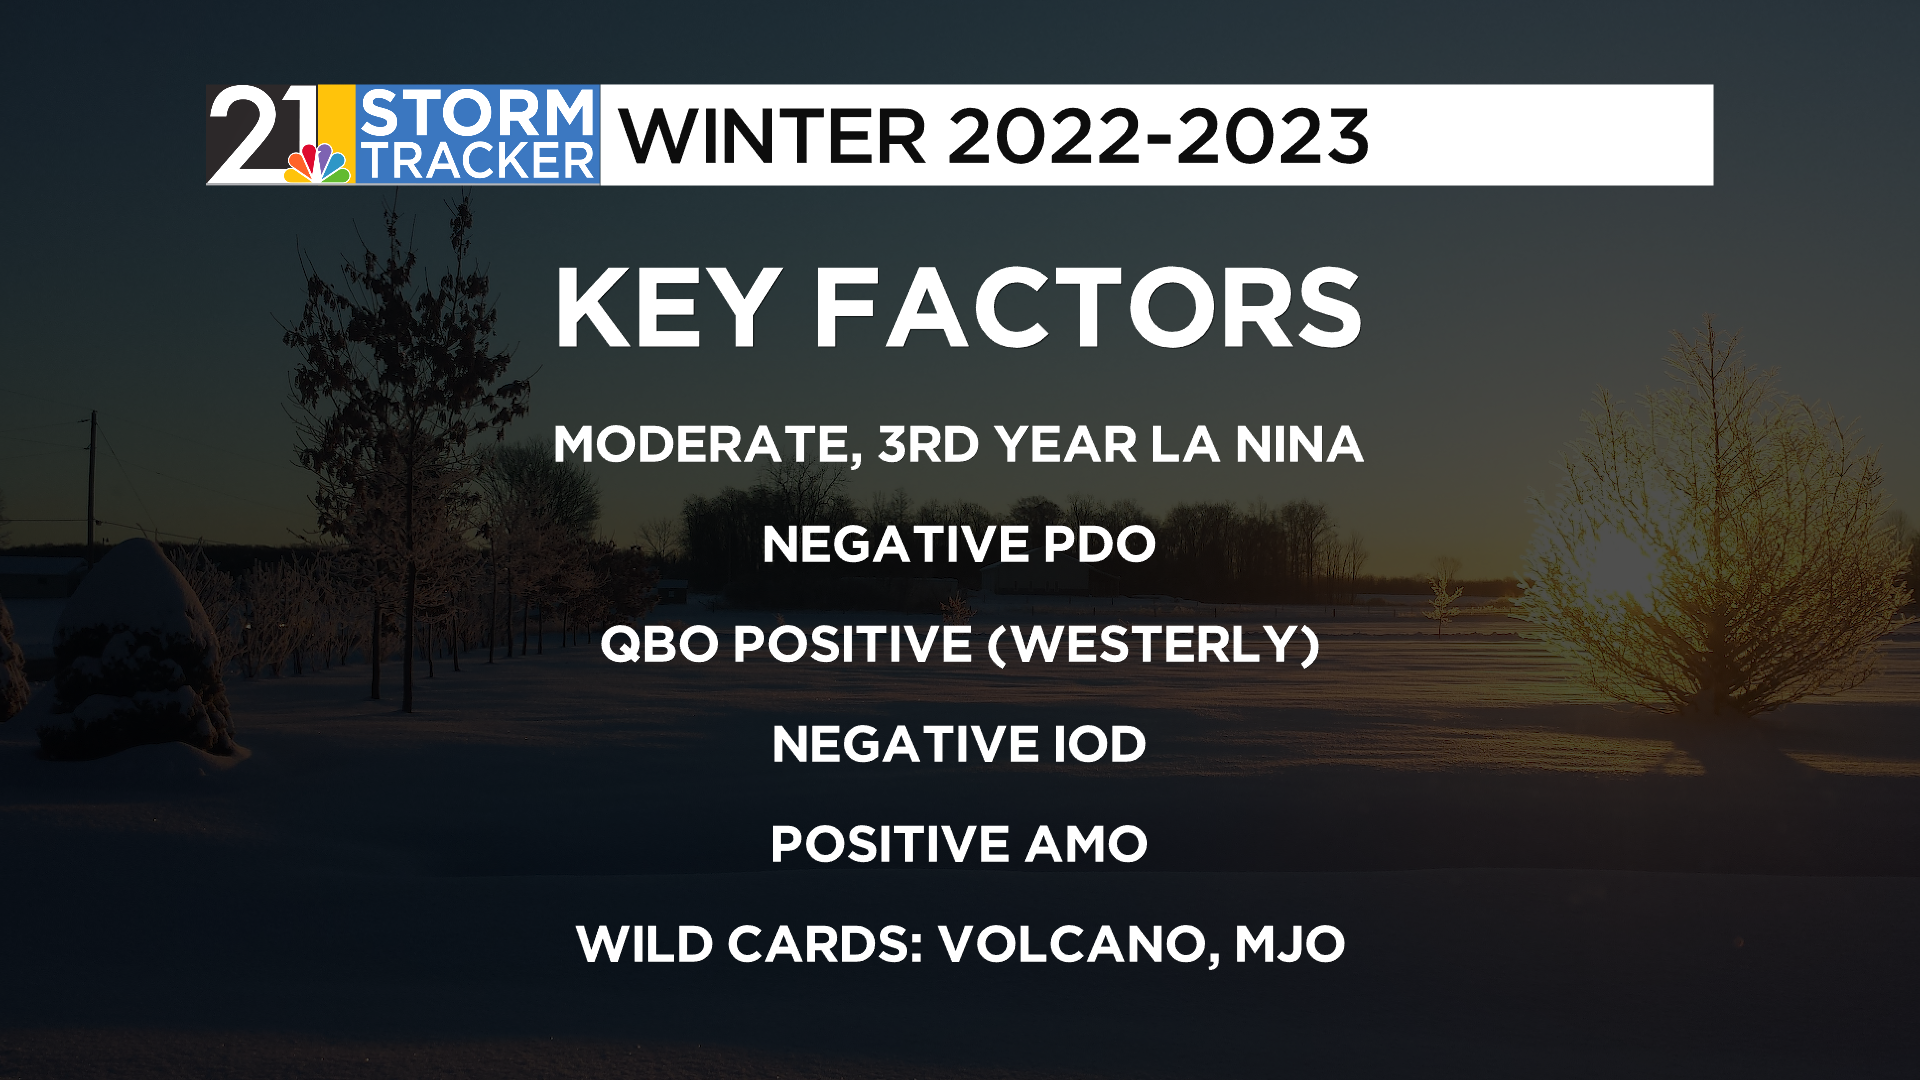
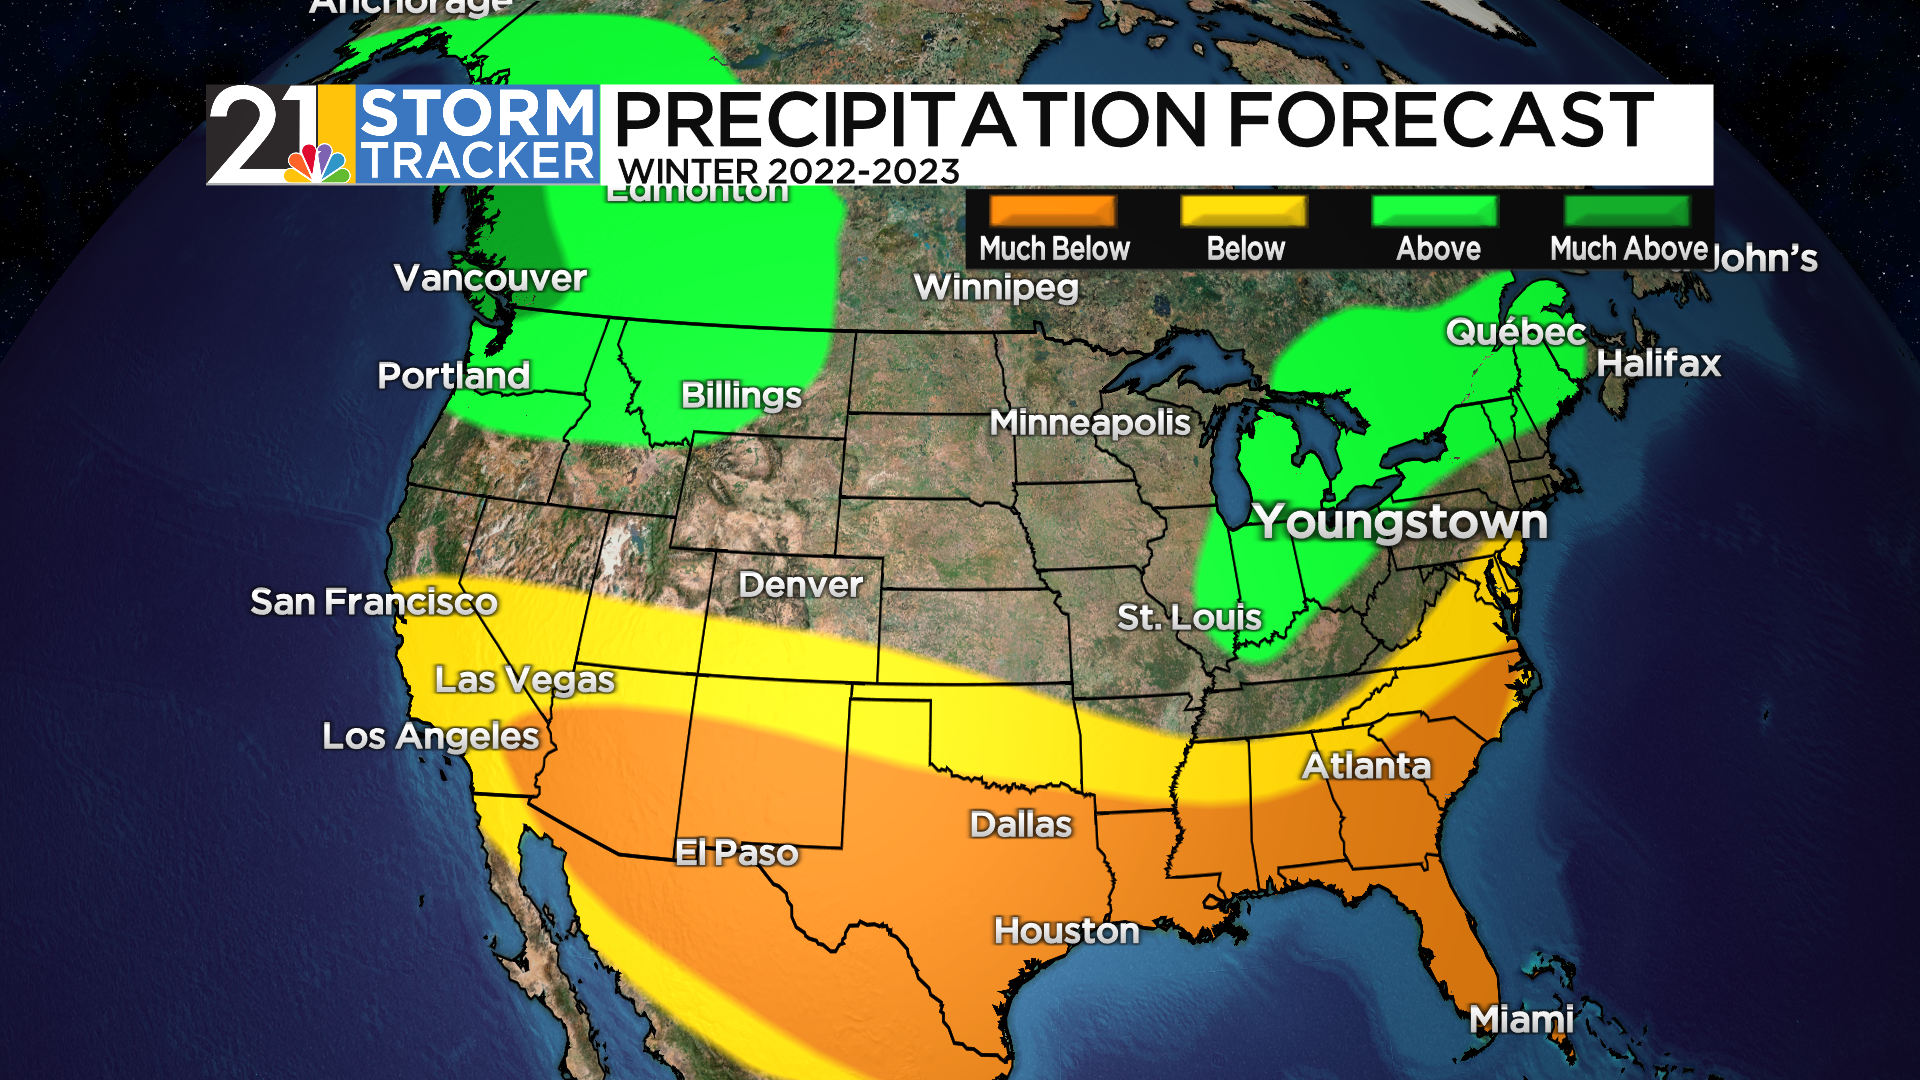
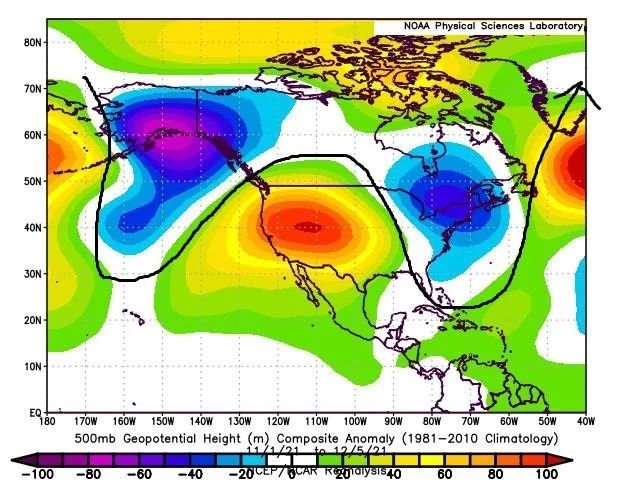
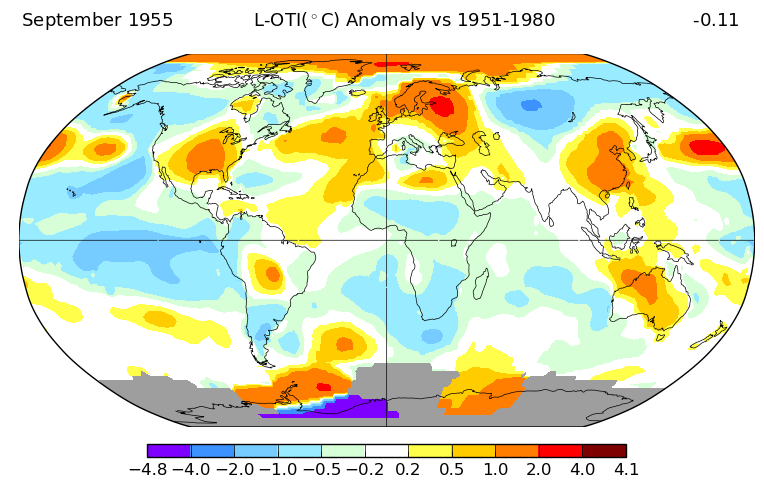
So the list of top “analogs” does include a couple of colder, snowier winters….but they are outnumbered by the warmer ones. At the top of the list: 2022-23, the 2nd warmest winter in our area since 1950:

Long Range Weather Models
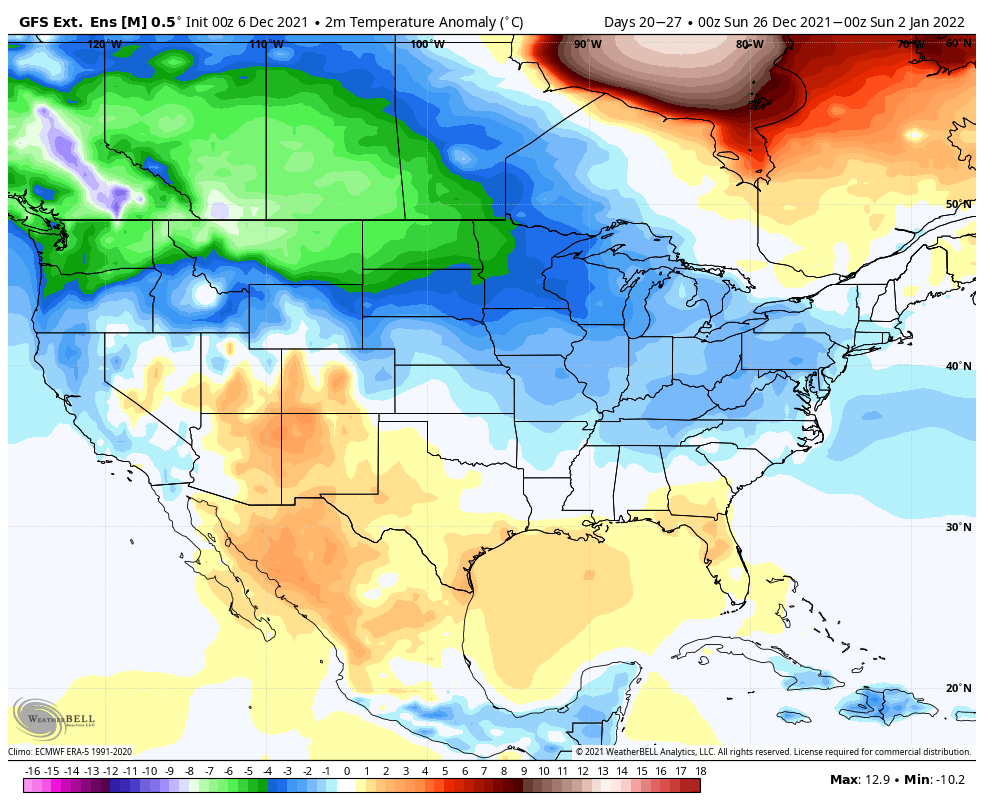
In addition to analogs (looking backward), we do utilize long-range weather models (looking forward) when constructing a seasonal forecast. These models cannot be taken literally but they can be another tool at our disposal.
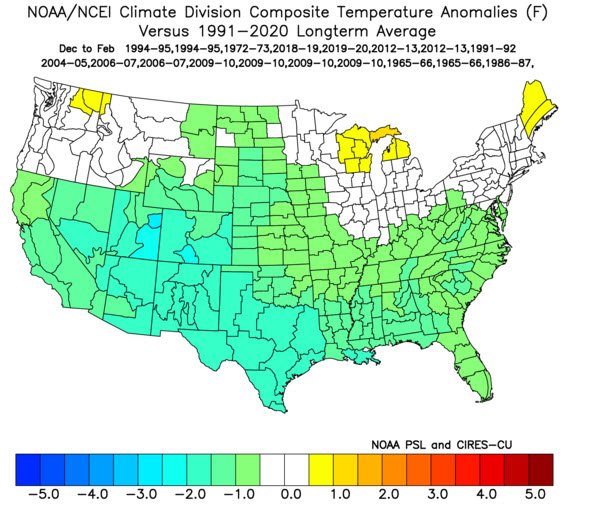
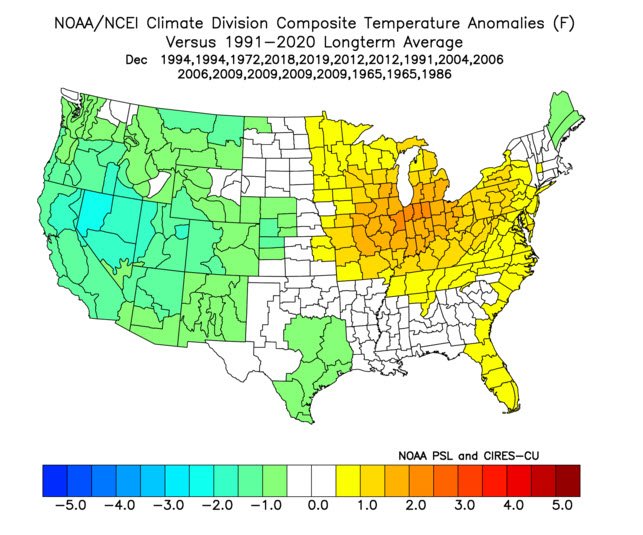
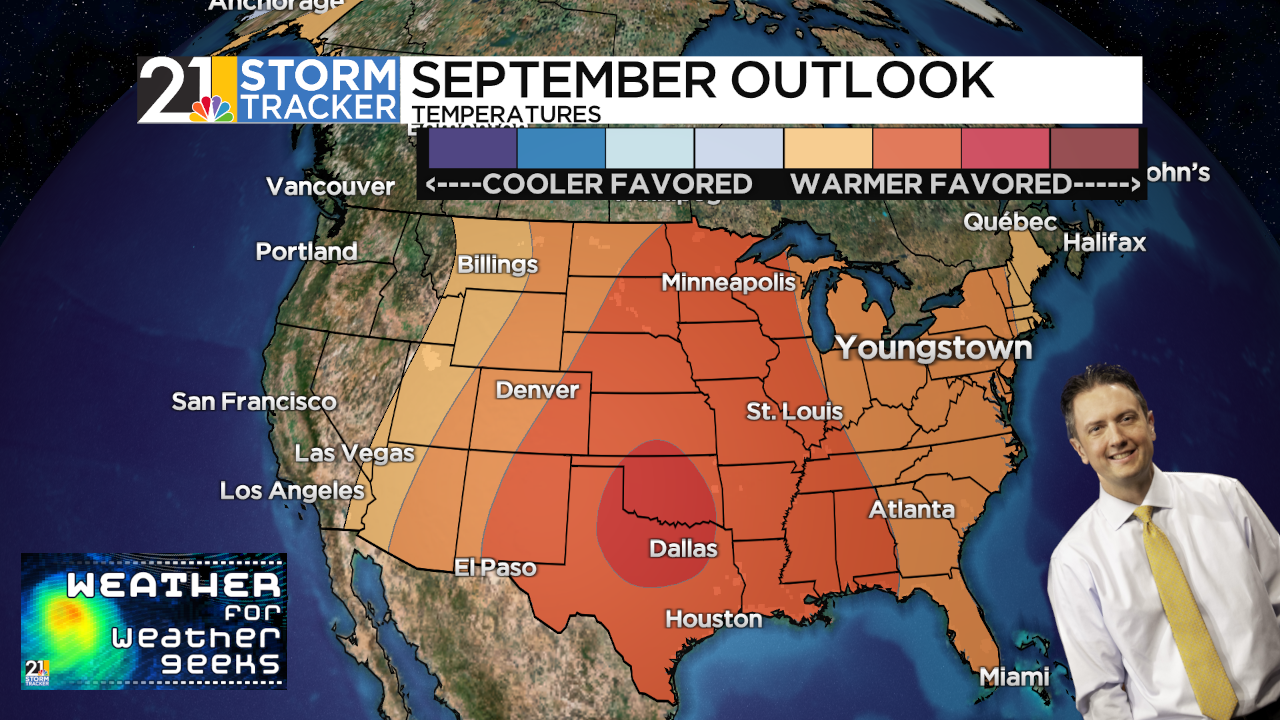
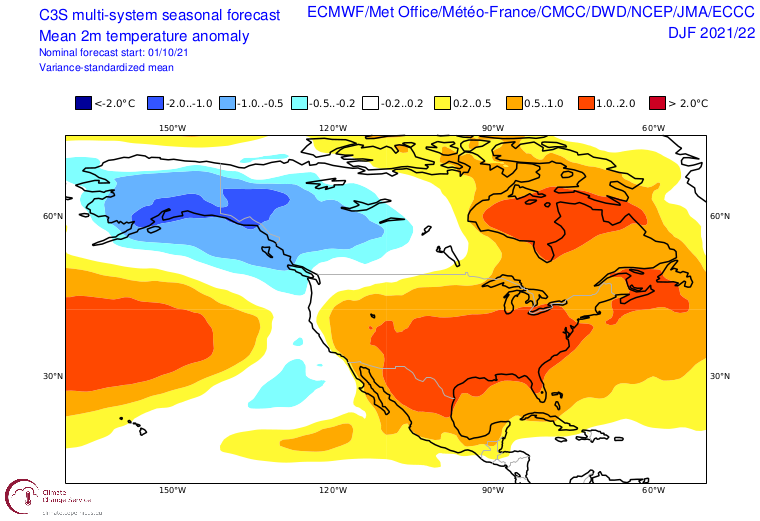
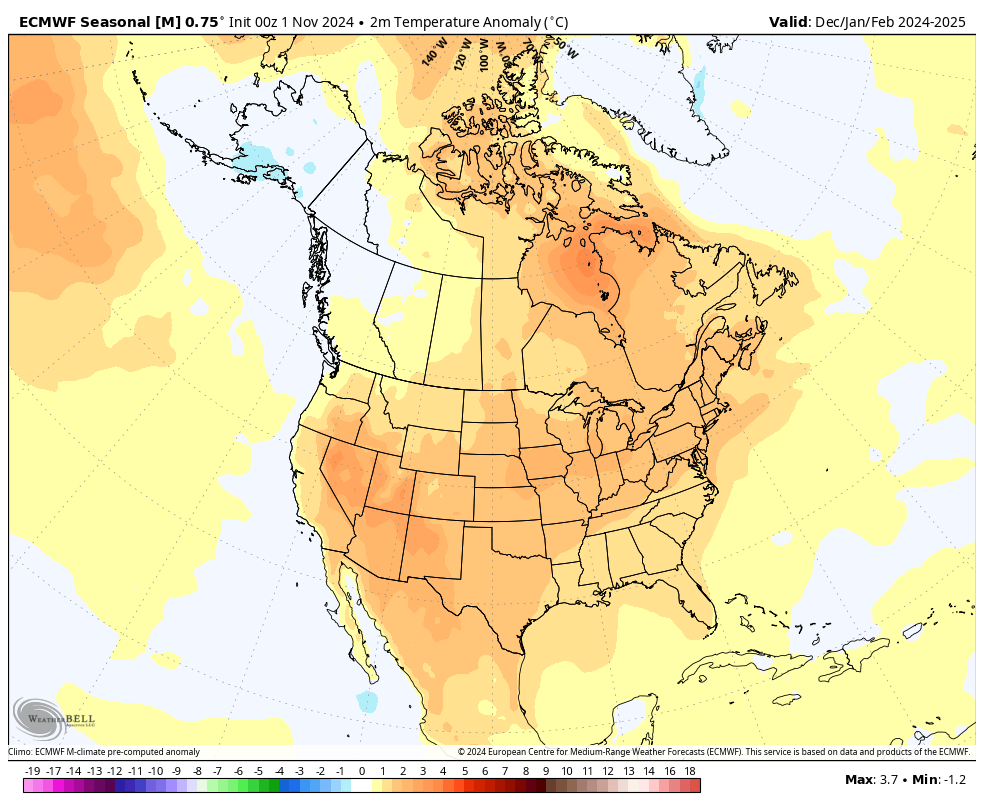
While I won’t post every model that is out there, here’s a couple for the winter season. The European model shows a very warm winter for much of North America:
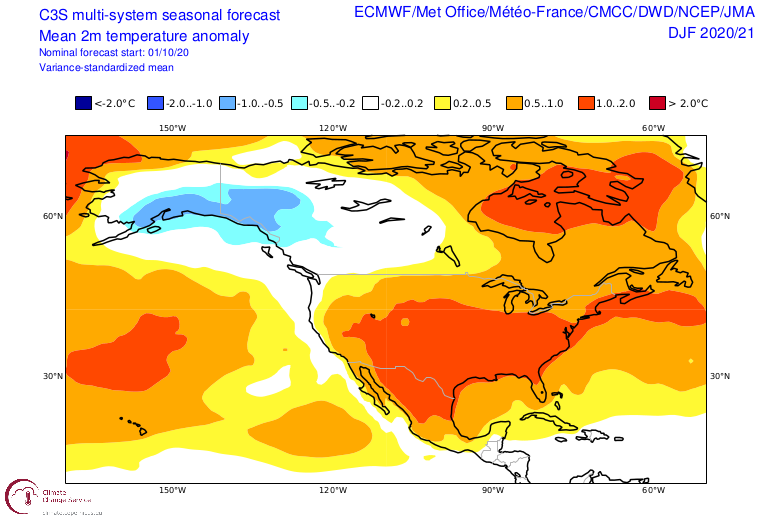
The Canadian long range modeling is not as warm-looking:

Getting To The Forecast
As you may have concluded by now, lots of things are pointing toward yet another warm winter season in our area. Lots of things are just hostile to sustained cold once again.
1) A weak La Nina and strongly negative PDO
2) An unfavorable combination of a solar “maximum” and strongly positive QBO
3) “Background state” of the earth’s atmosphere, which is, of course, warming. This is independent of (1) and (2) and will be a factor even in winters that otherwise have more favorable conditions for cold in our part of the world.
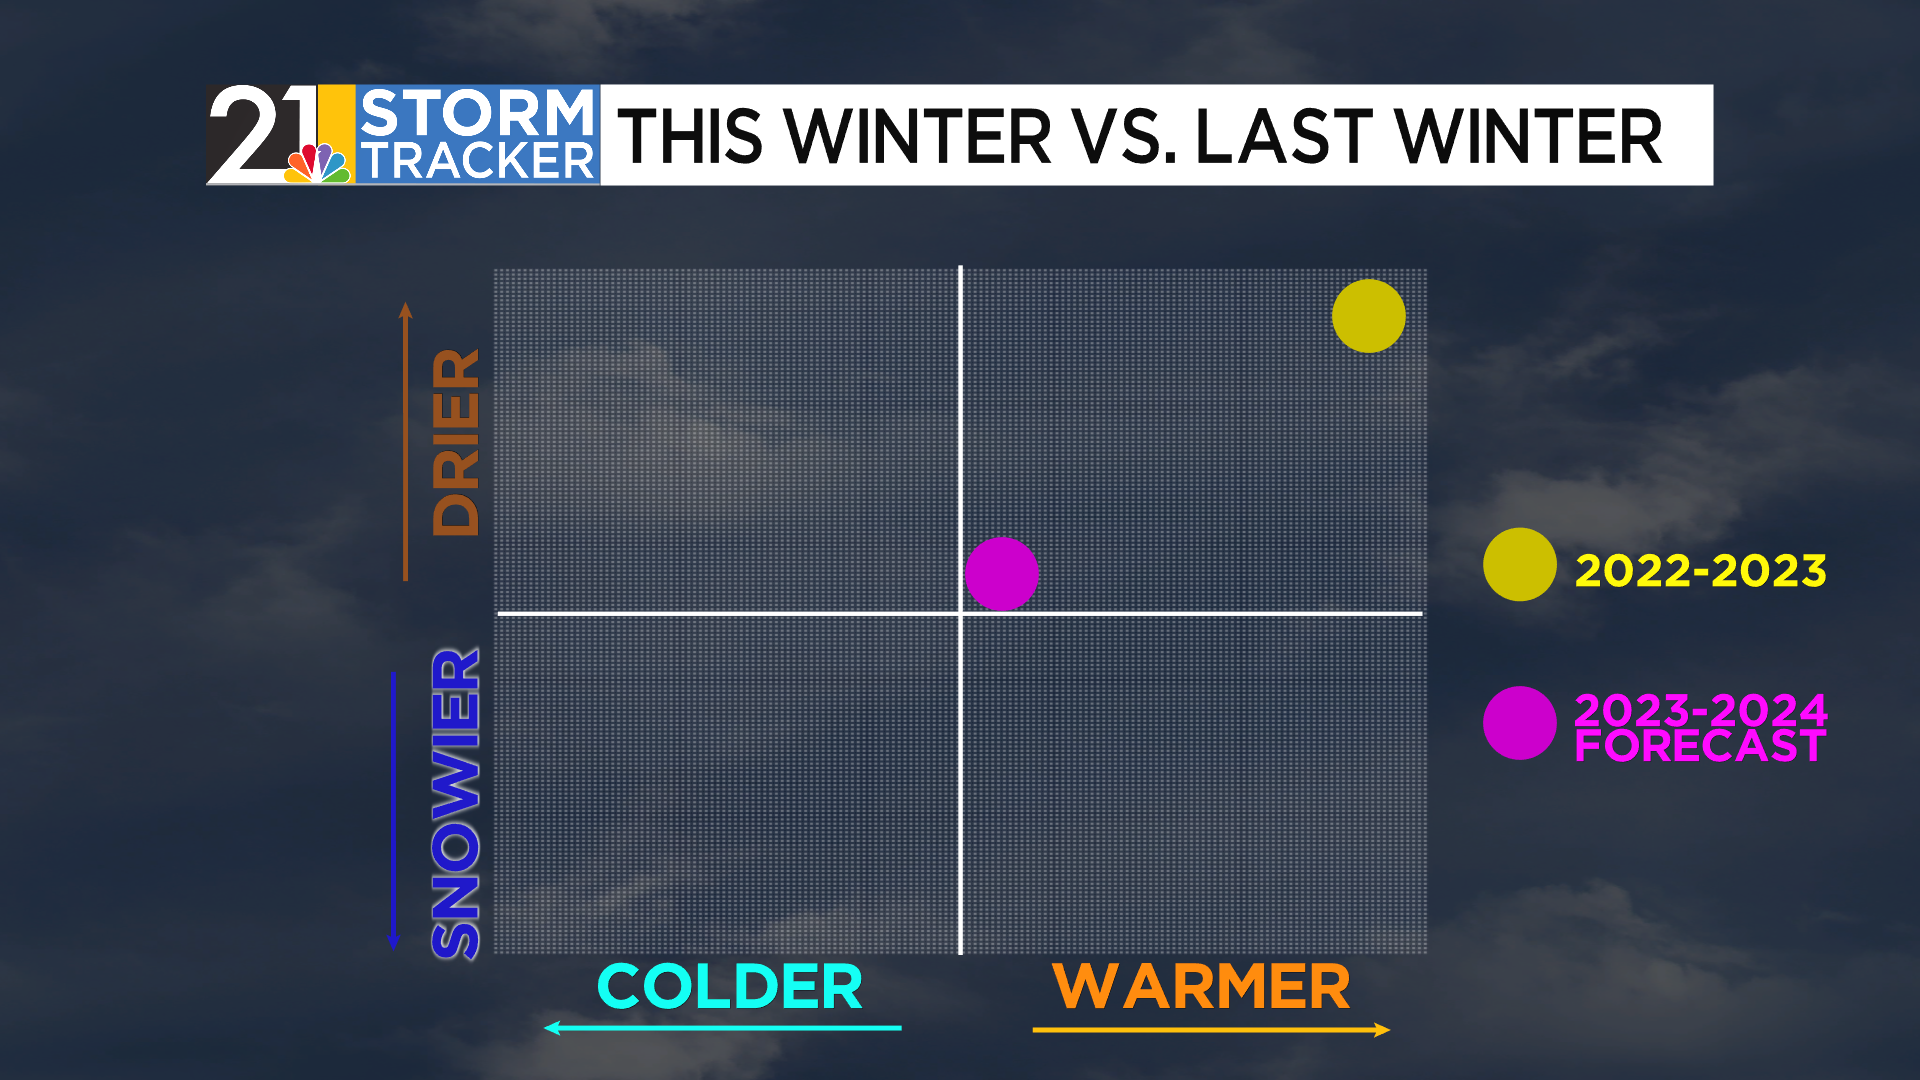
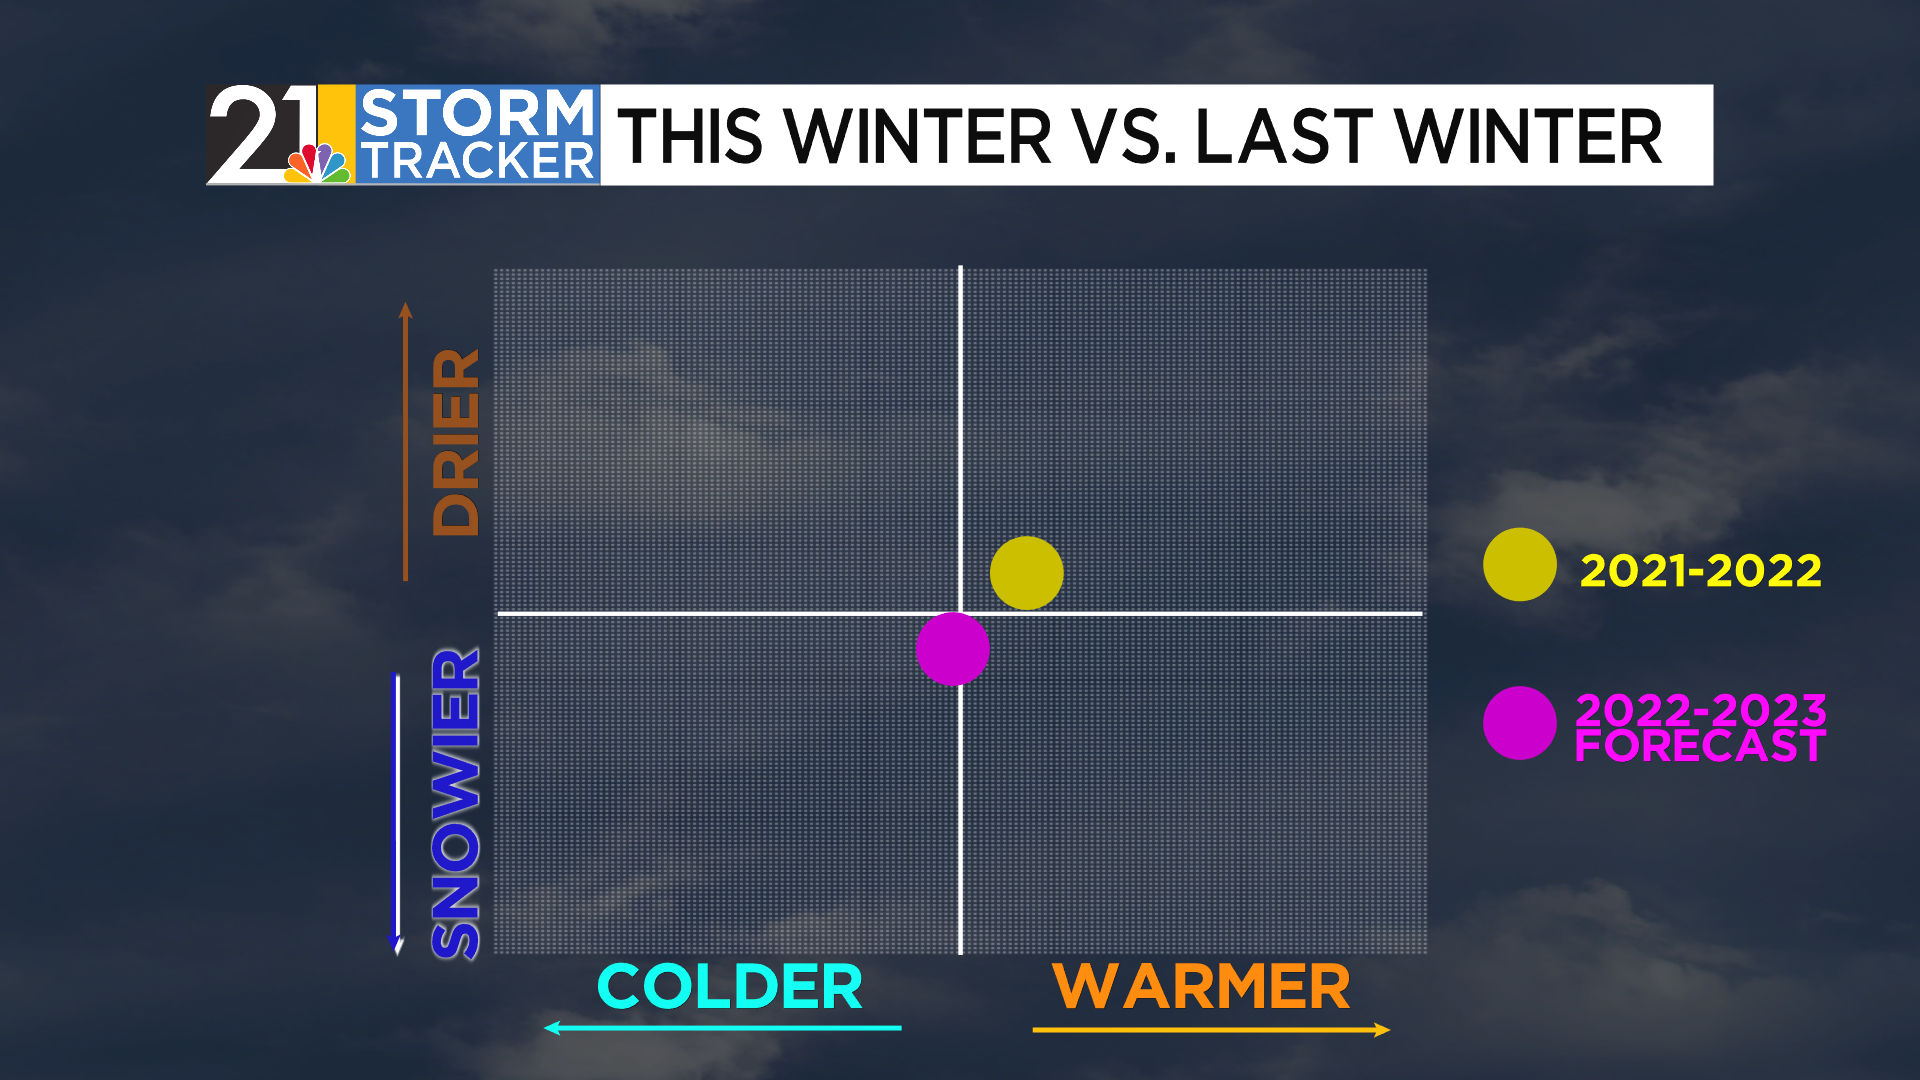
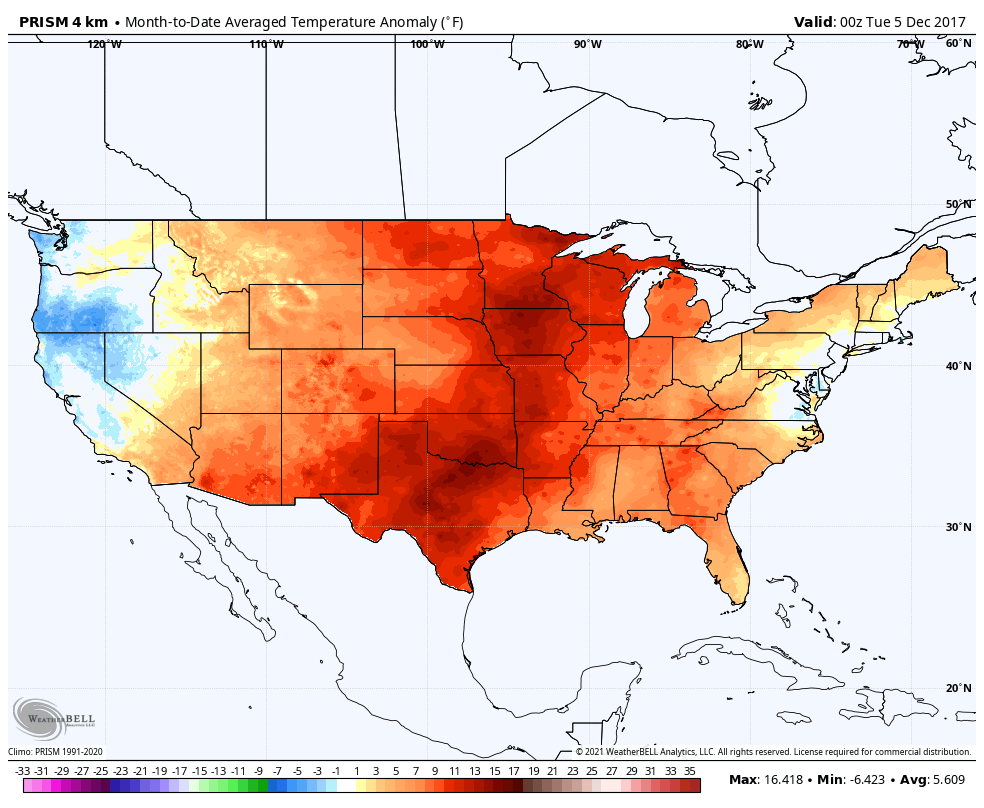
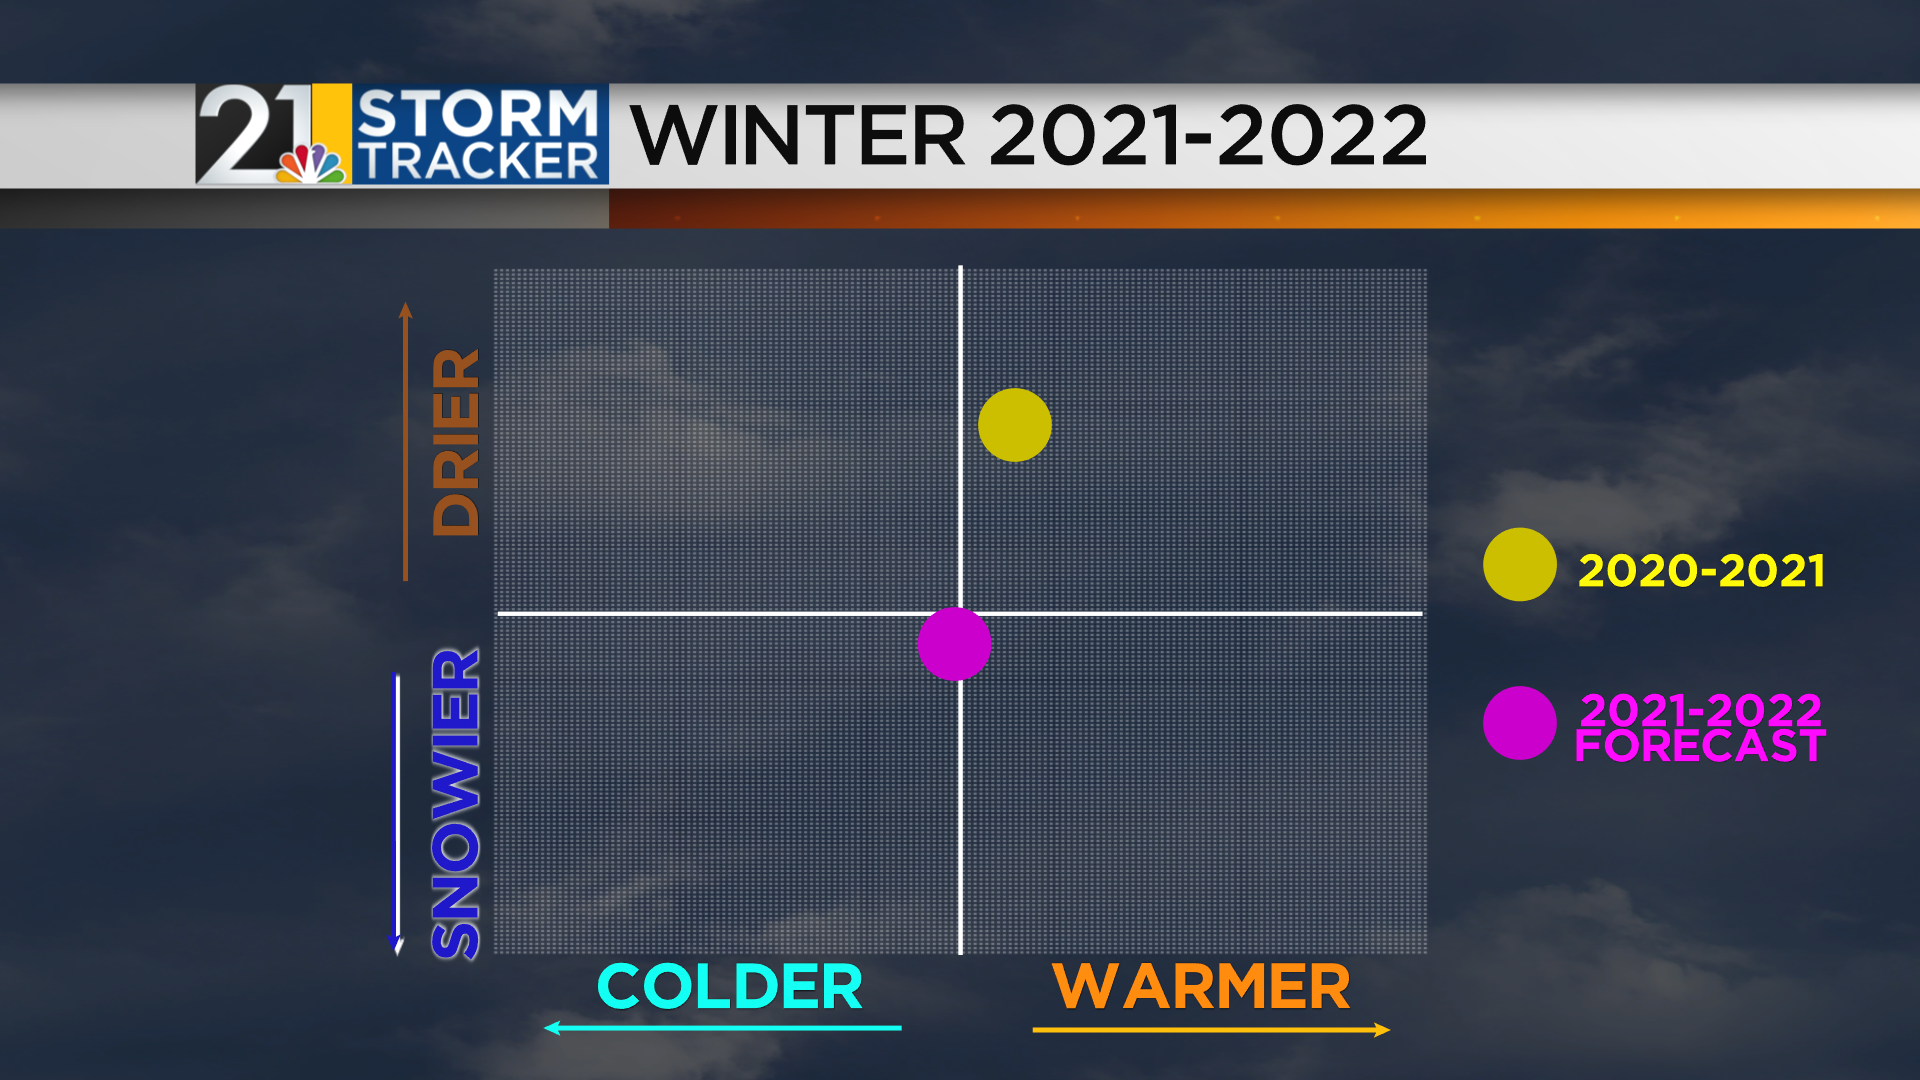
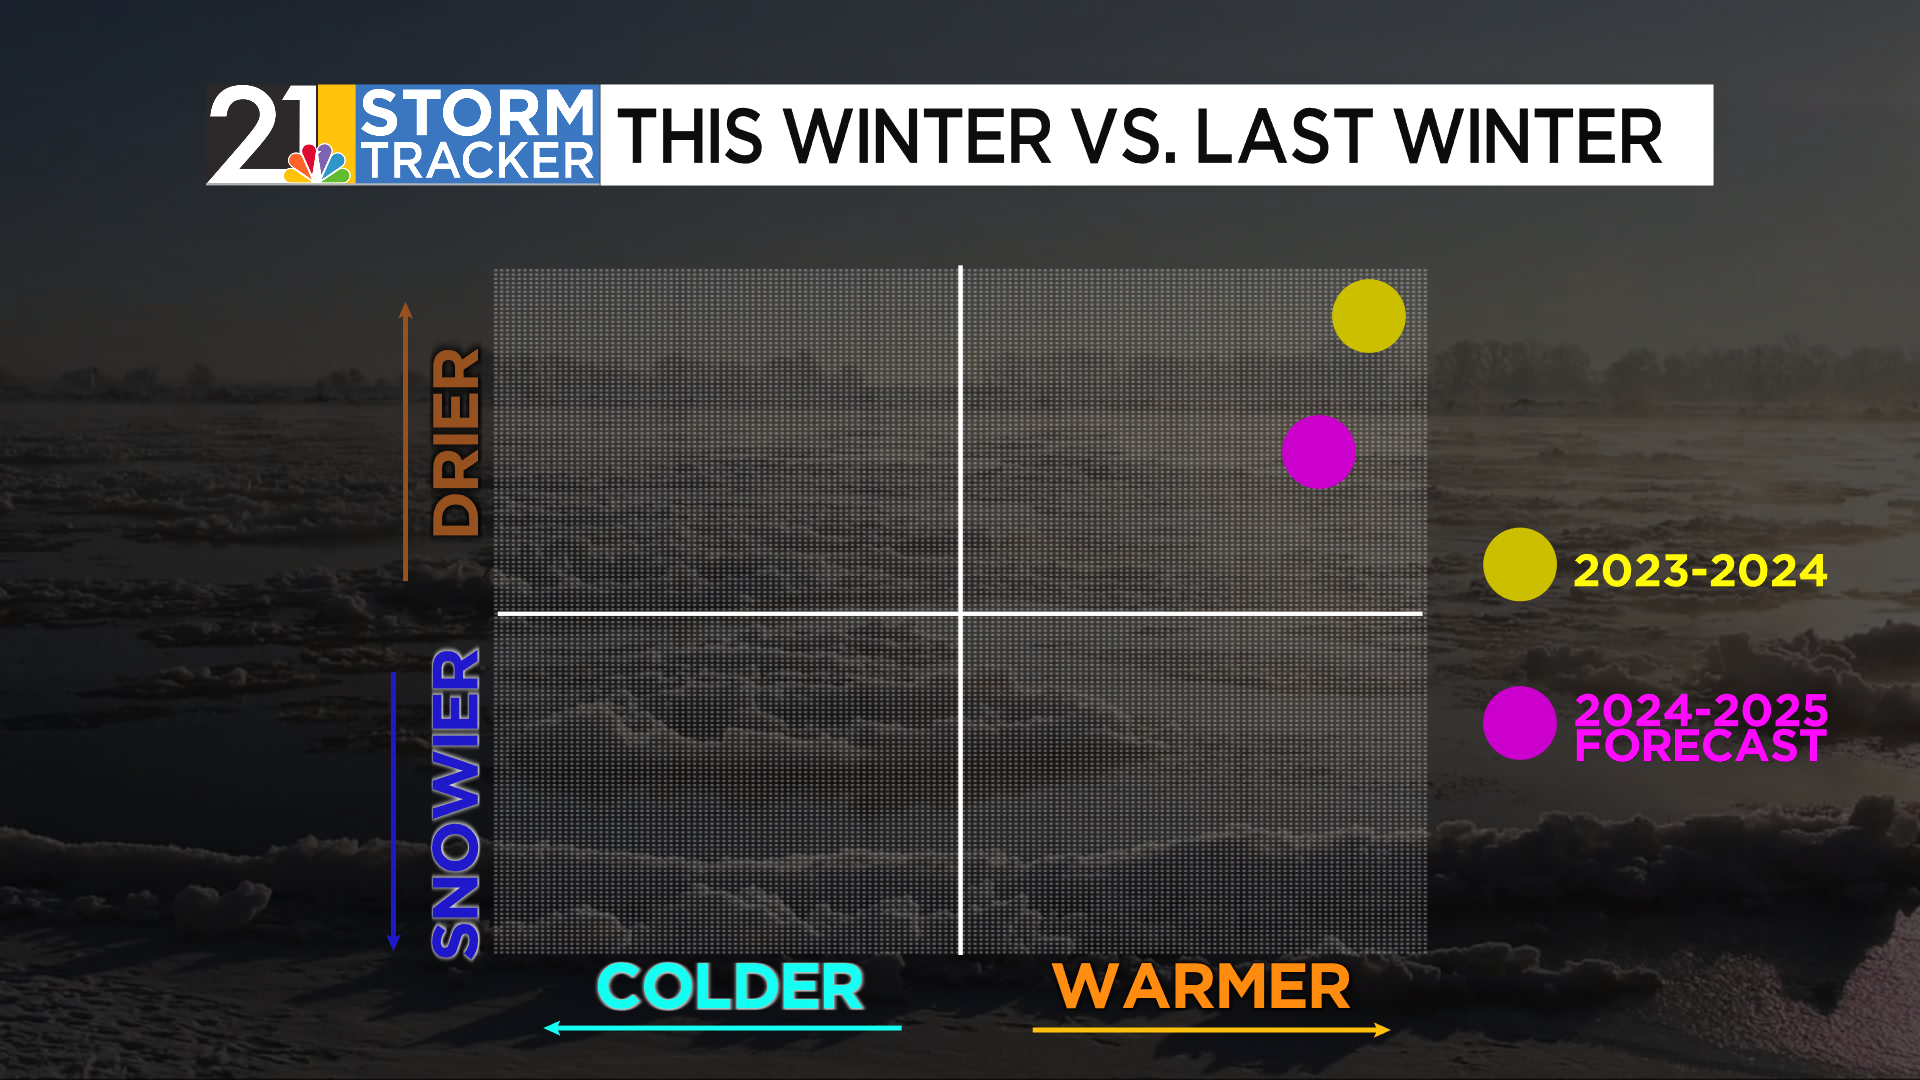
Here is where I envision winter 2024-25 comparing to 2023-24:
Explicitly predicting a winter as warm as the last 2 years would be a mighty bold forecast but i think the overall “flavor” of winter will be the same: above-average temperatures and below-average snow. Let’s look at the season month-by-month.
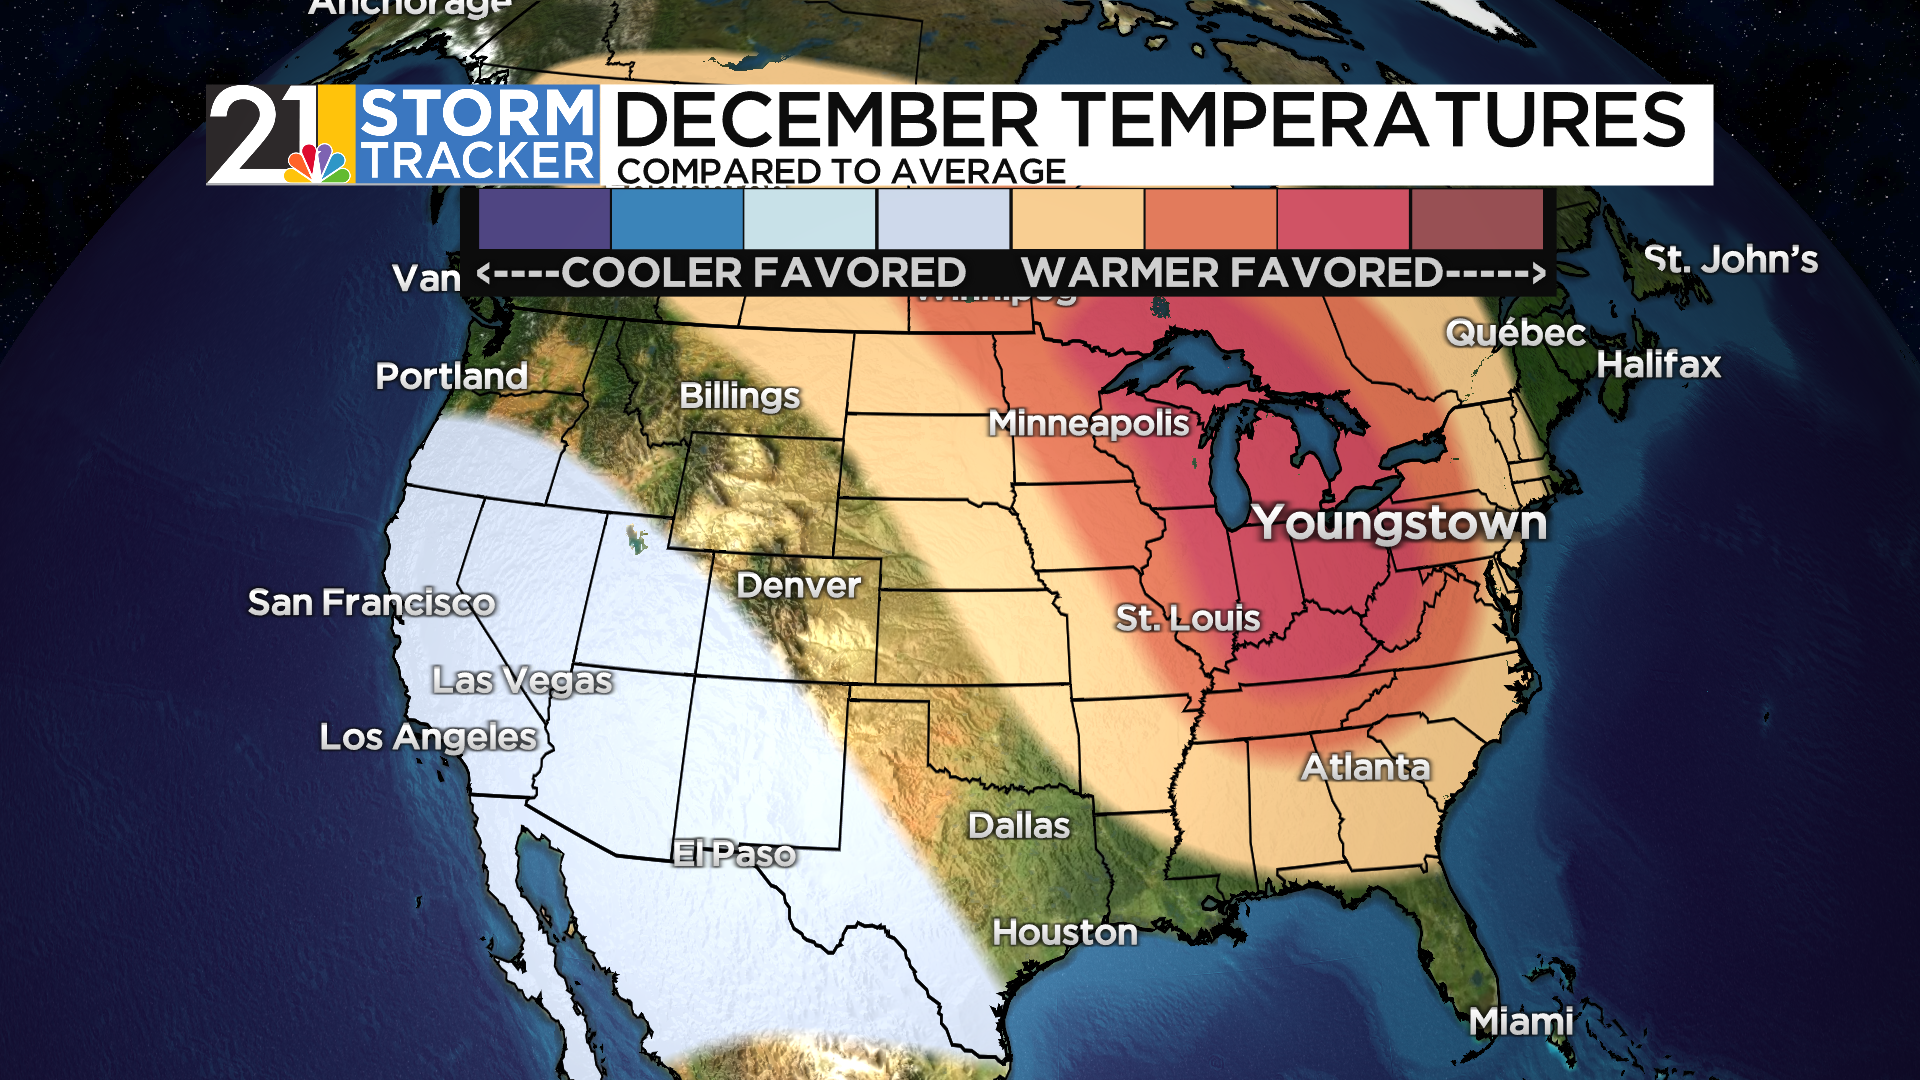
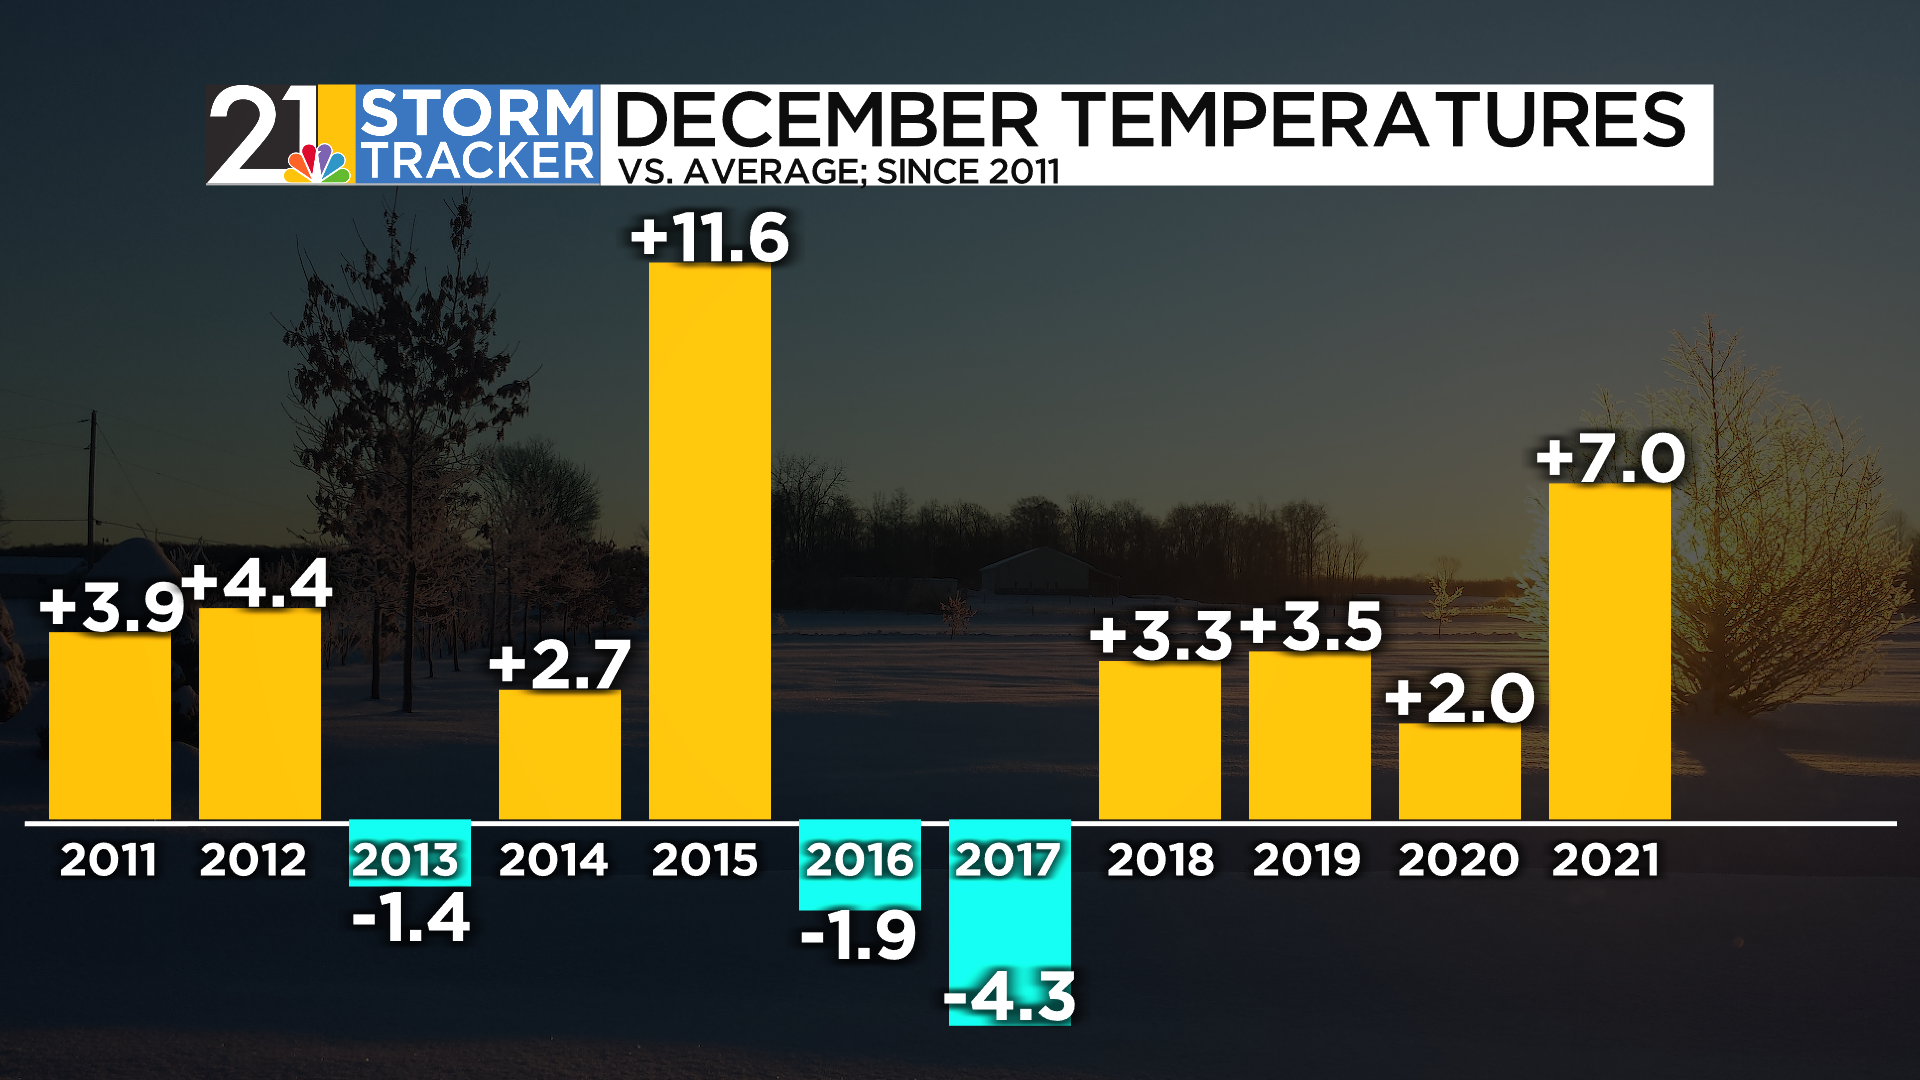
DECEMBER
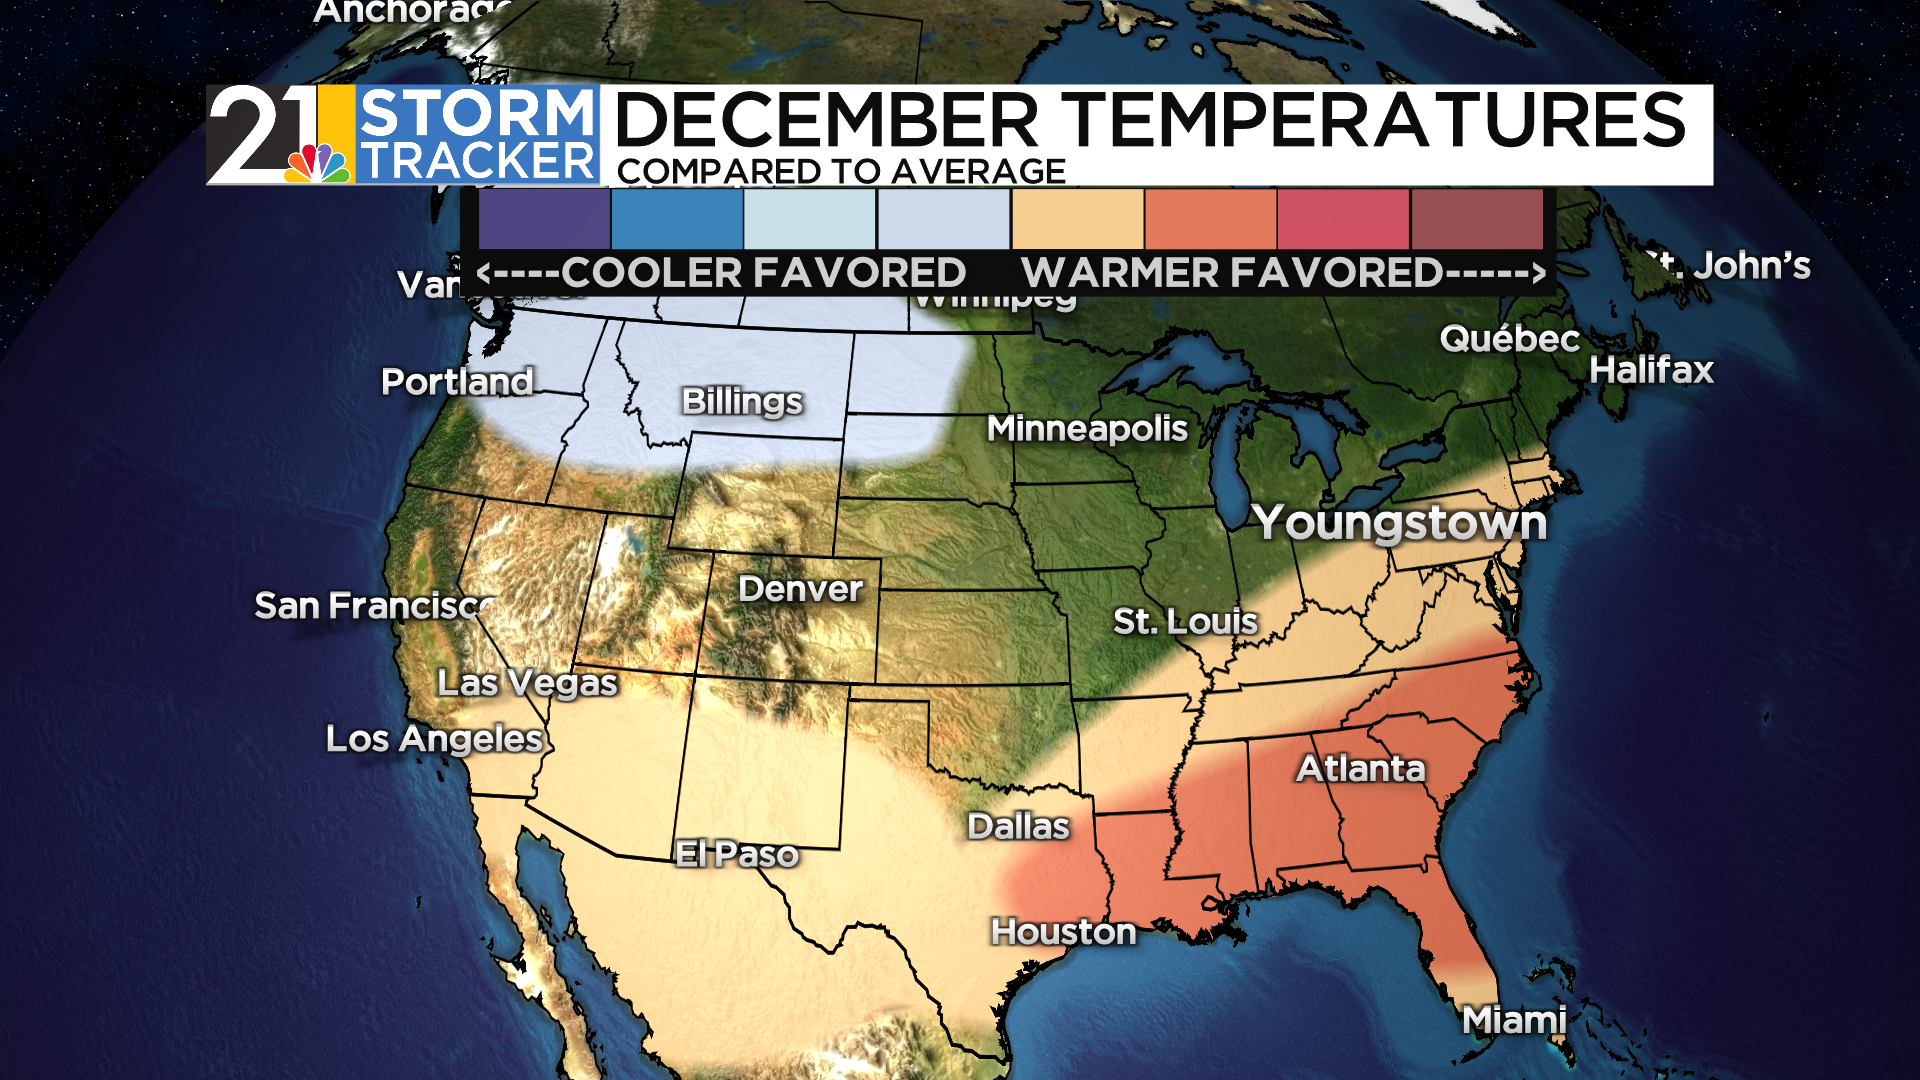
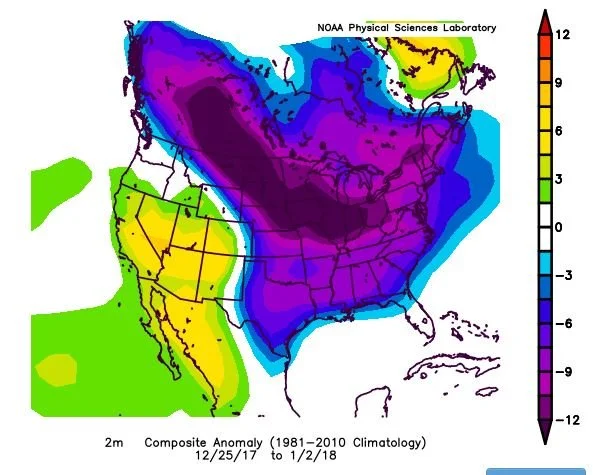
Early December may very well start with a continuation of November’s mild pattern, but windows of colder weather can become more numerous as the month wears on. Remember, in the extremely warm winter of 2022-2023 we had a brief but vicious outbreak of arctic air and wind at Christmas.
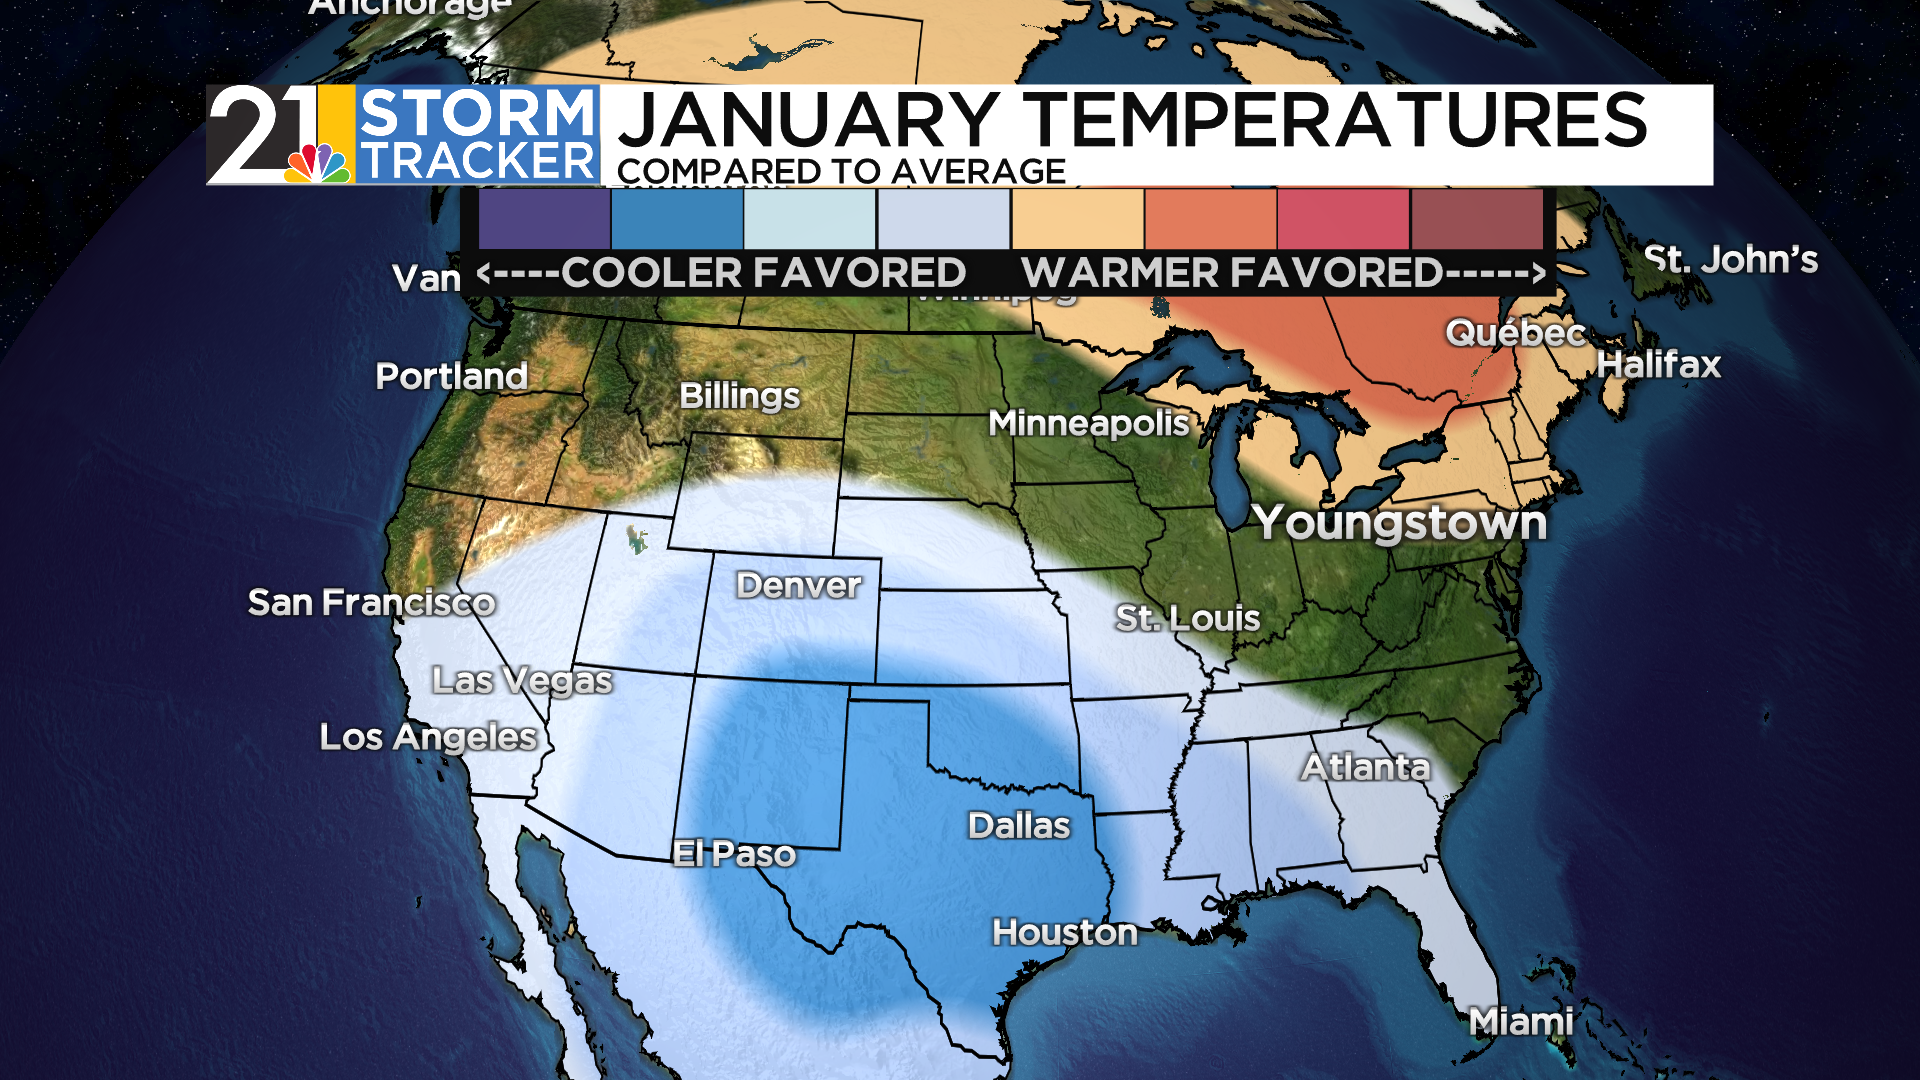
JANUARY

Either January or February could be an absolute “torch”. I suspect both will be warmer than average, but one could be historically warm. I will place my chips on January.
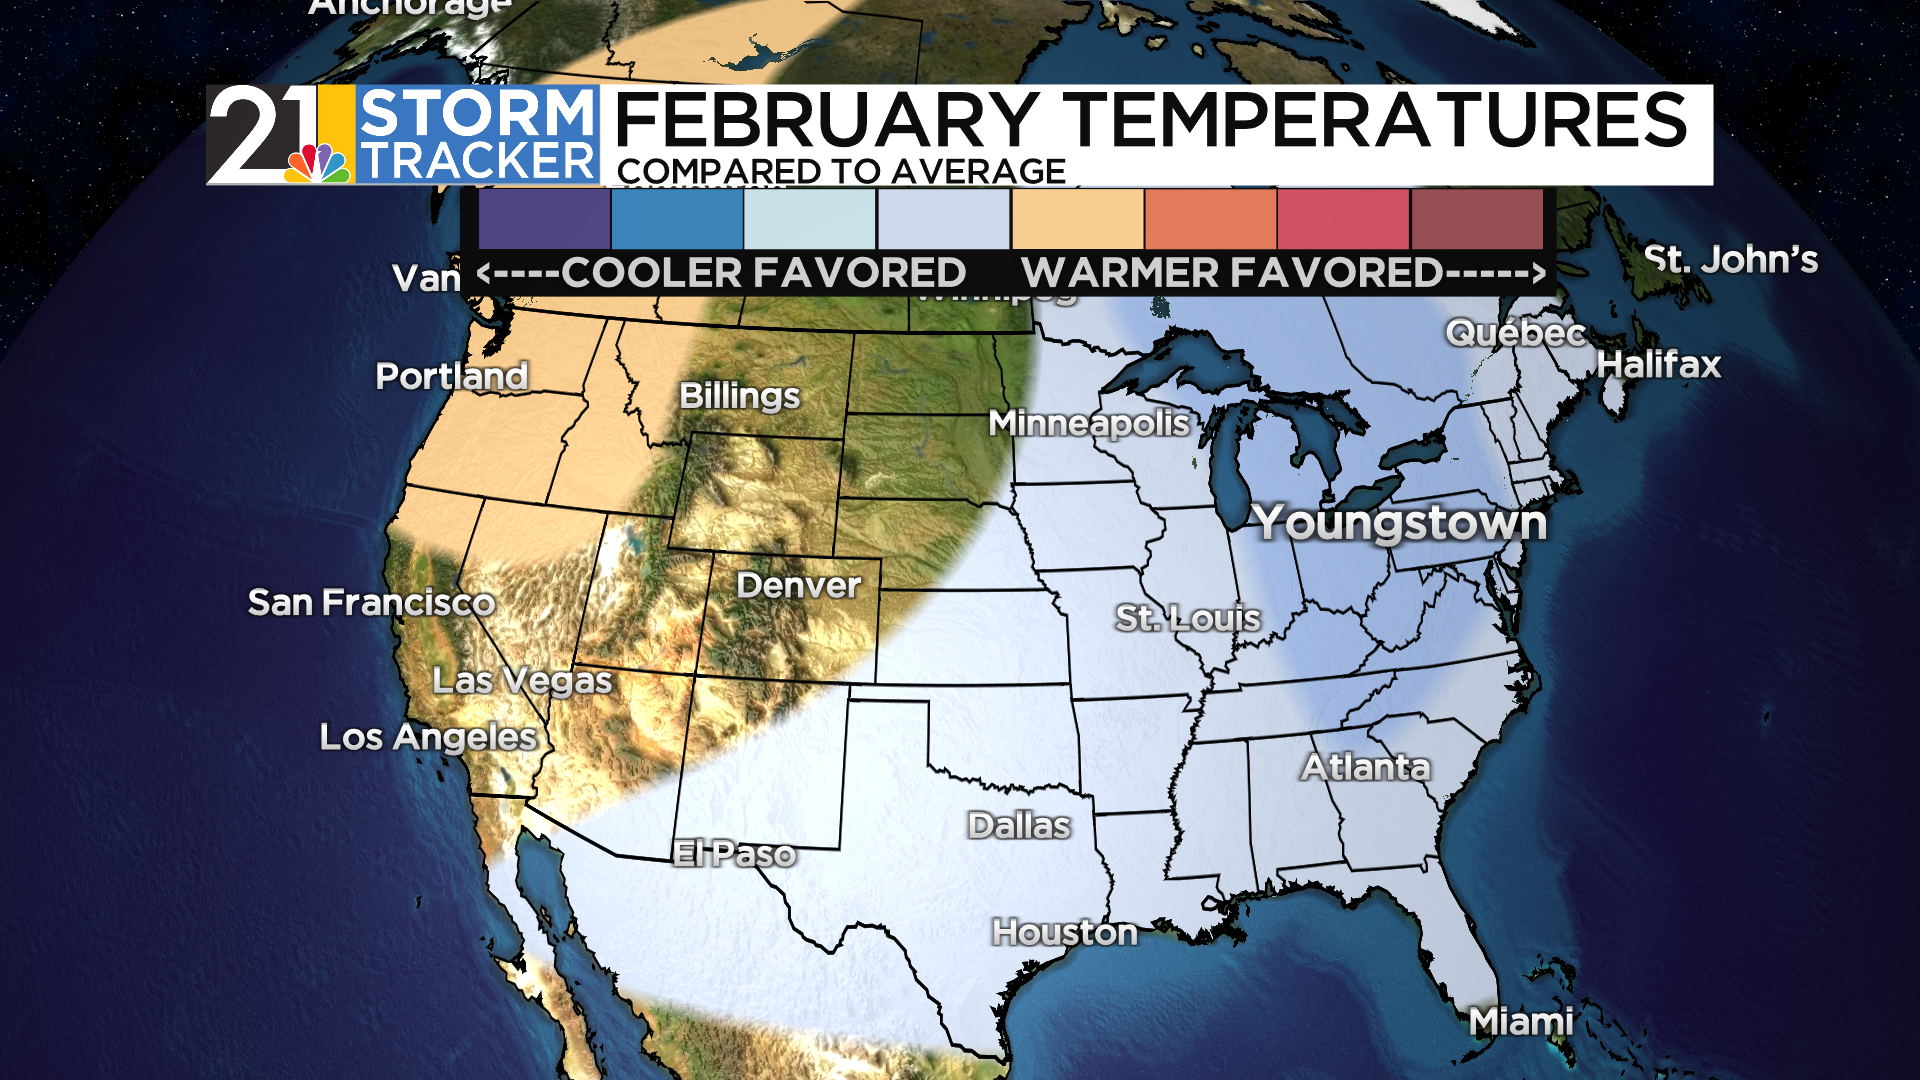
FEBRUARY

When looking at our analog years, it’s fairly common for February to feature a deeper trough (and hence, colder/stormier weather) along the West Coast and a potent ridge of high pressure downstream. February may not be as warm compared to average as January, but it won’t surprise me if we start to see some green buds popping up toward he end of the month.
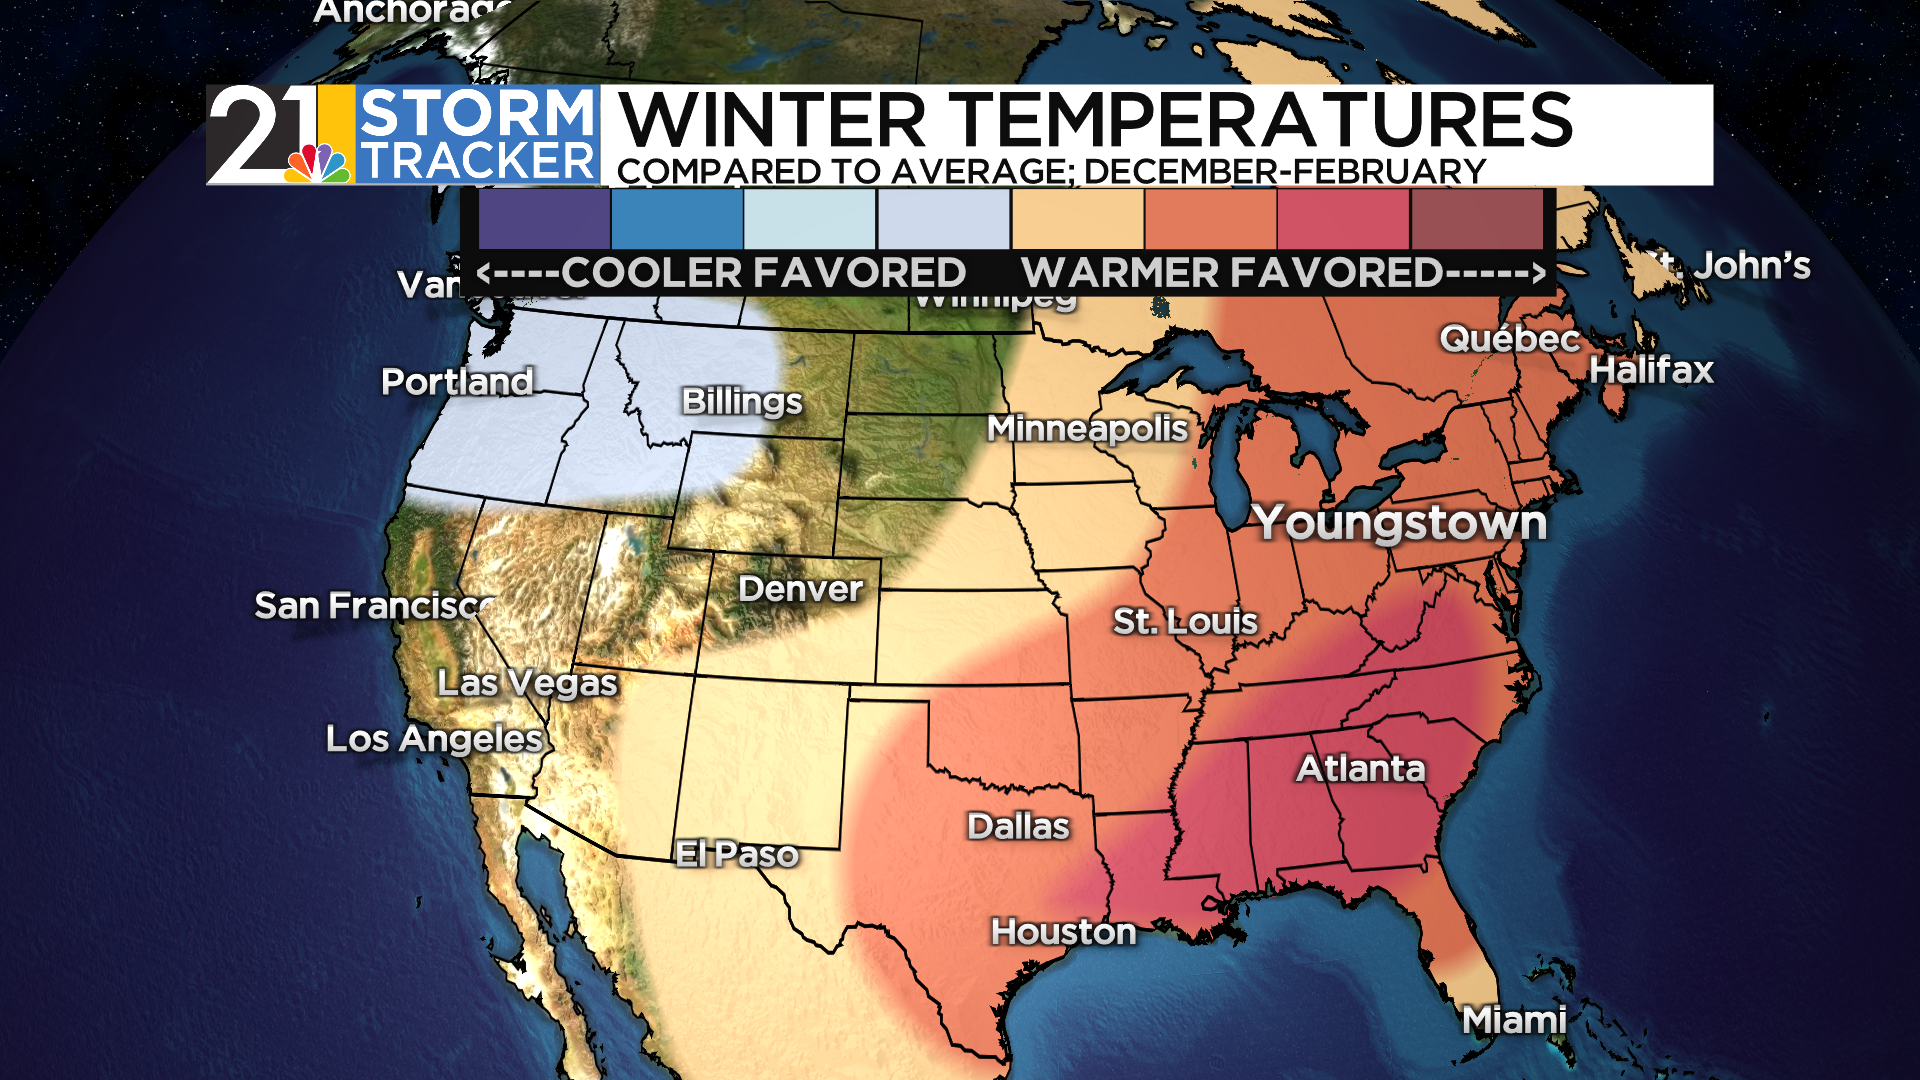
The overall winter map:
PRECIPITATION/SNOW
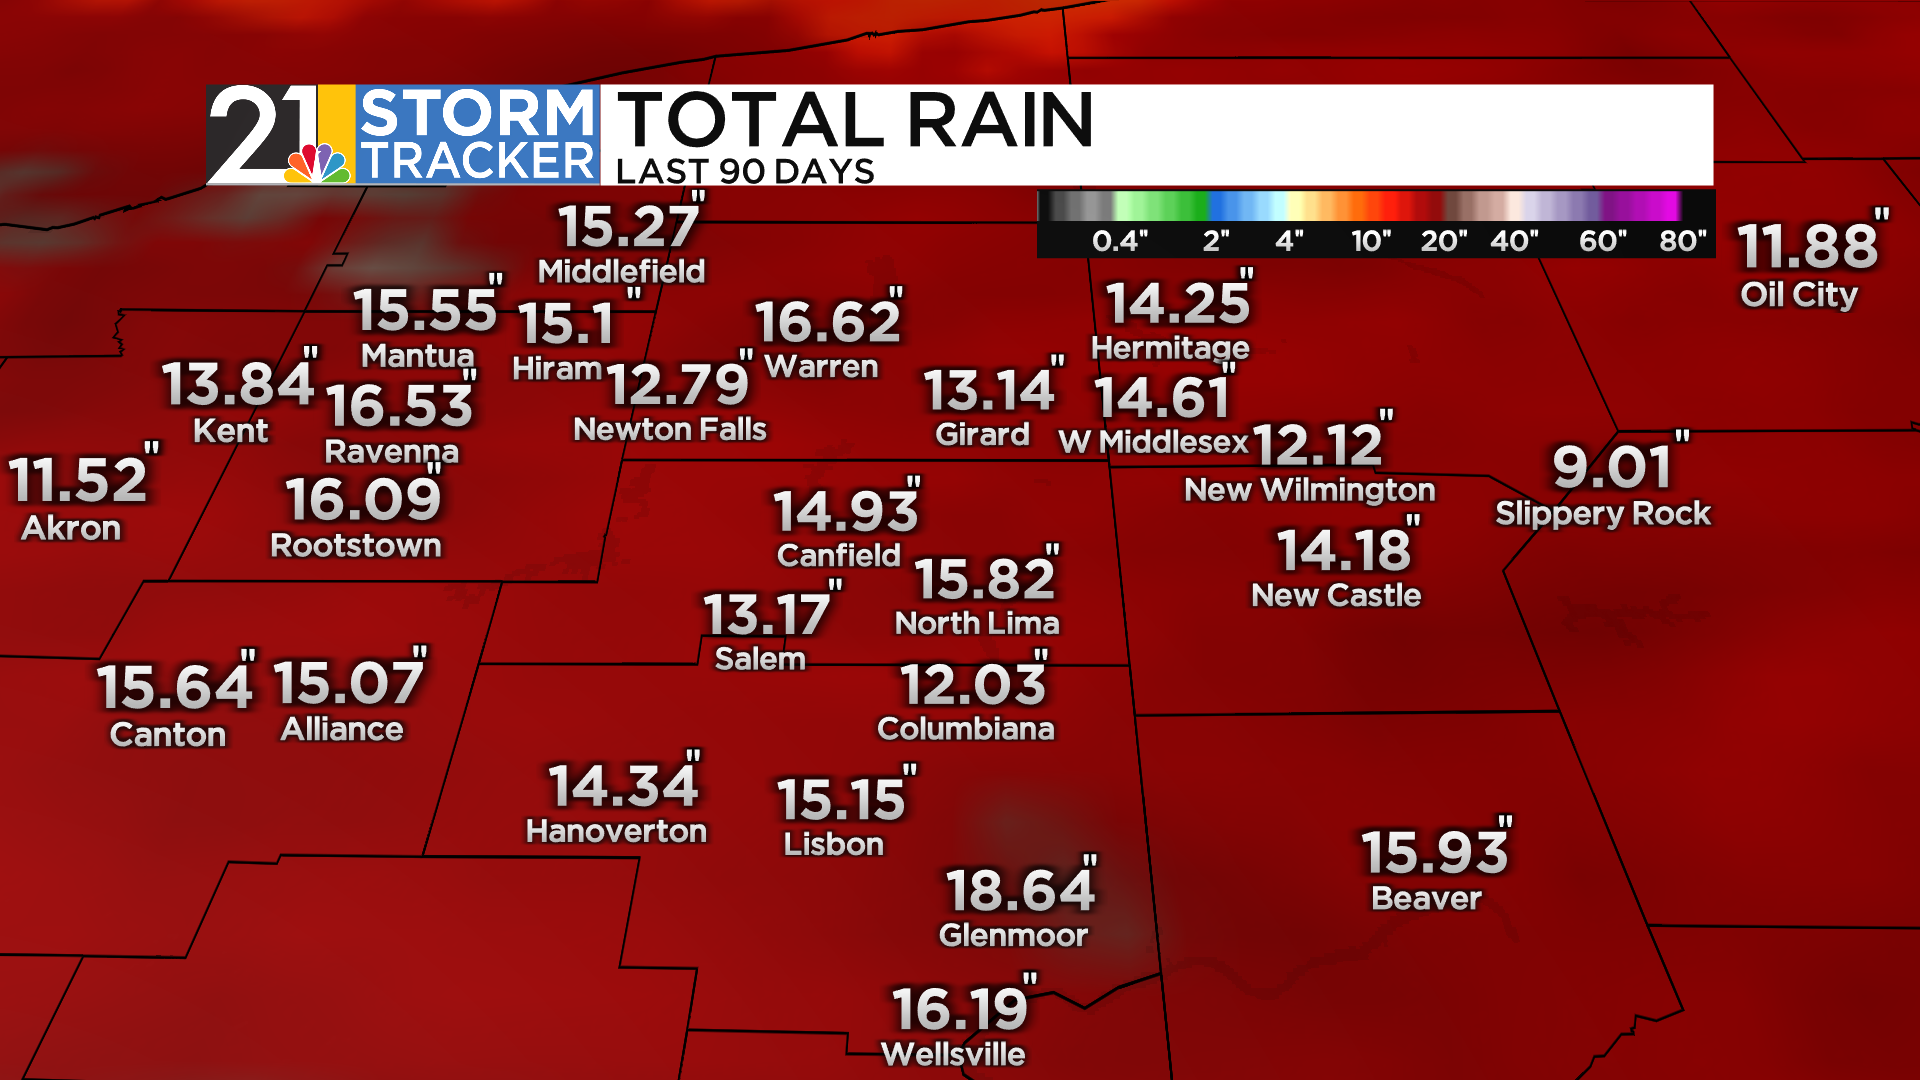
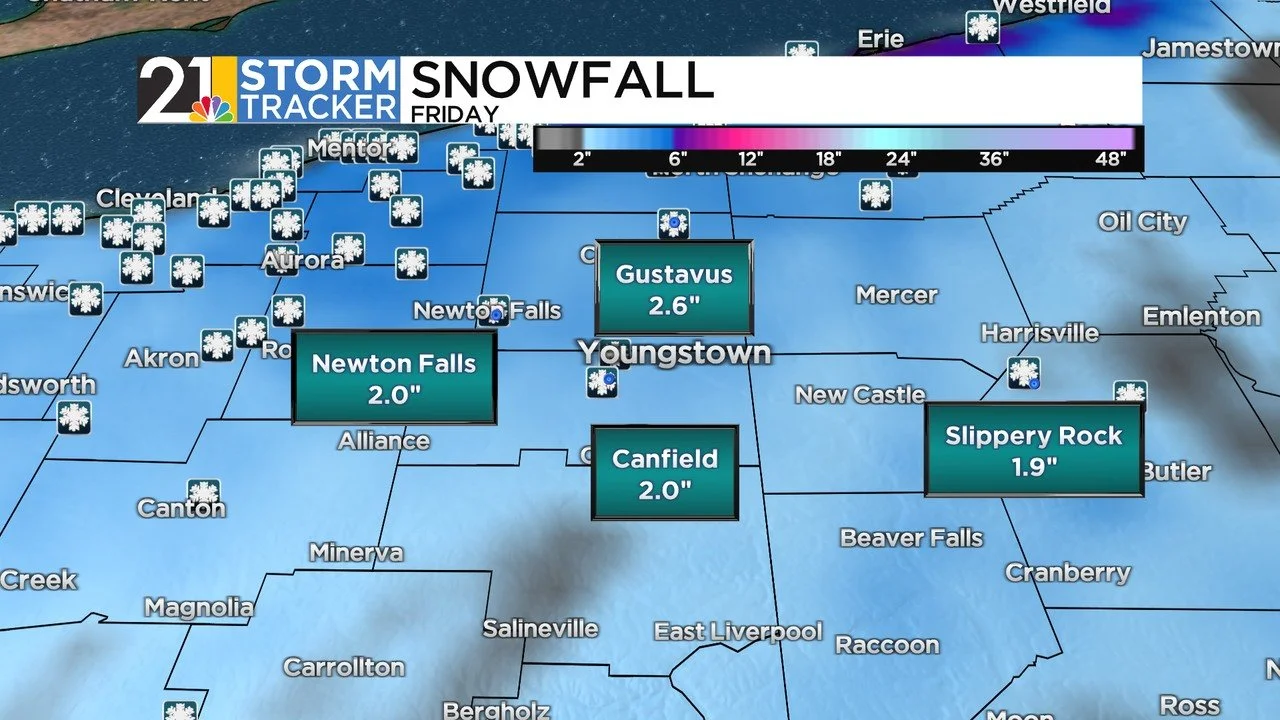
No surprise that a warm winter is typically not a very snowy one. That said, snow forecasting is quite tricky on a seasonal scale. One BIG storm or lake-effect event in the middle of an otherwise snow-free season can skew the numbers. Again, I would not explicitly predict the very puny snow totals of the last couple of winters but I think it’ll be hard for snow totals to end up anywhere near average.
I do think that overall precipitation could be near average as there may be no big shortage of rain/mixed precipitation events.

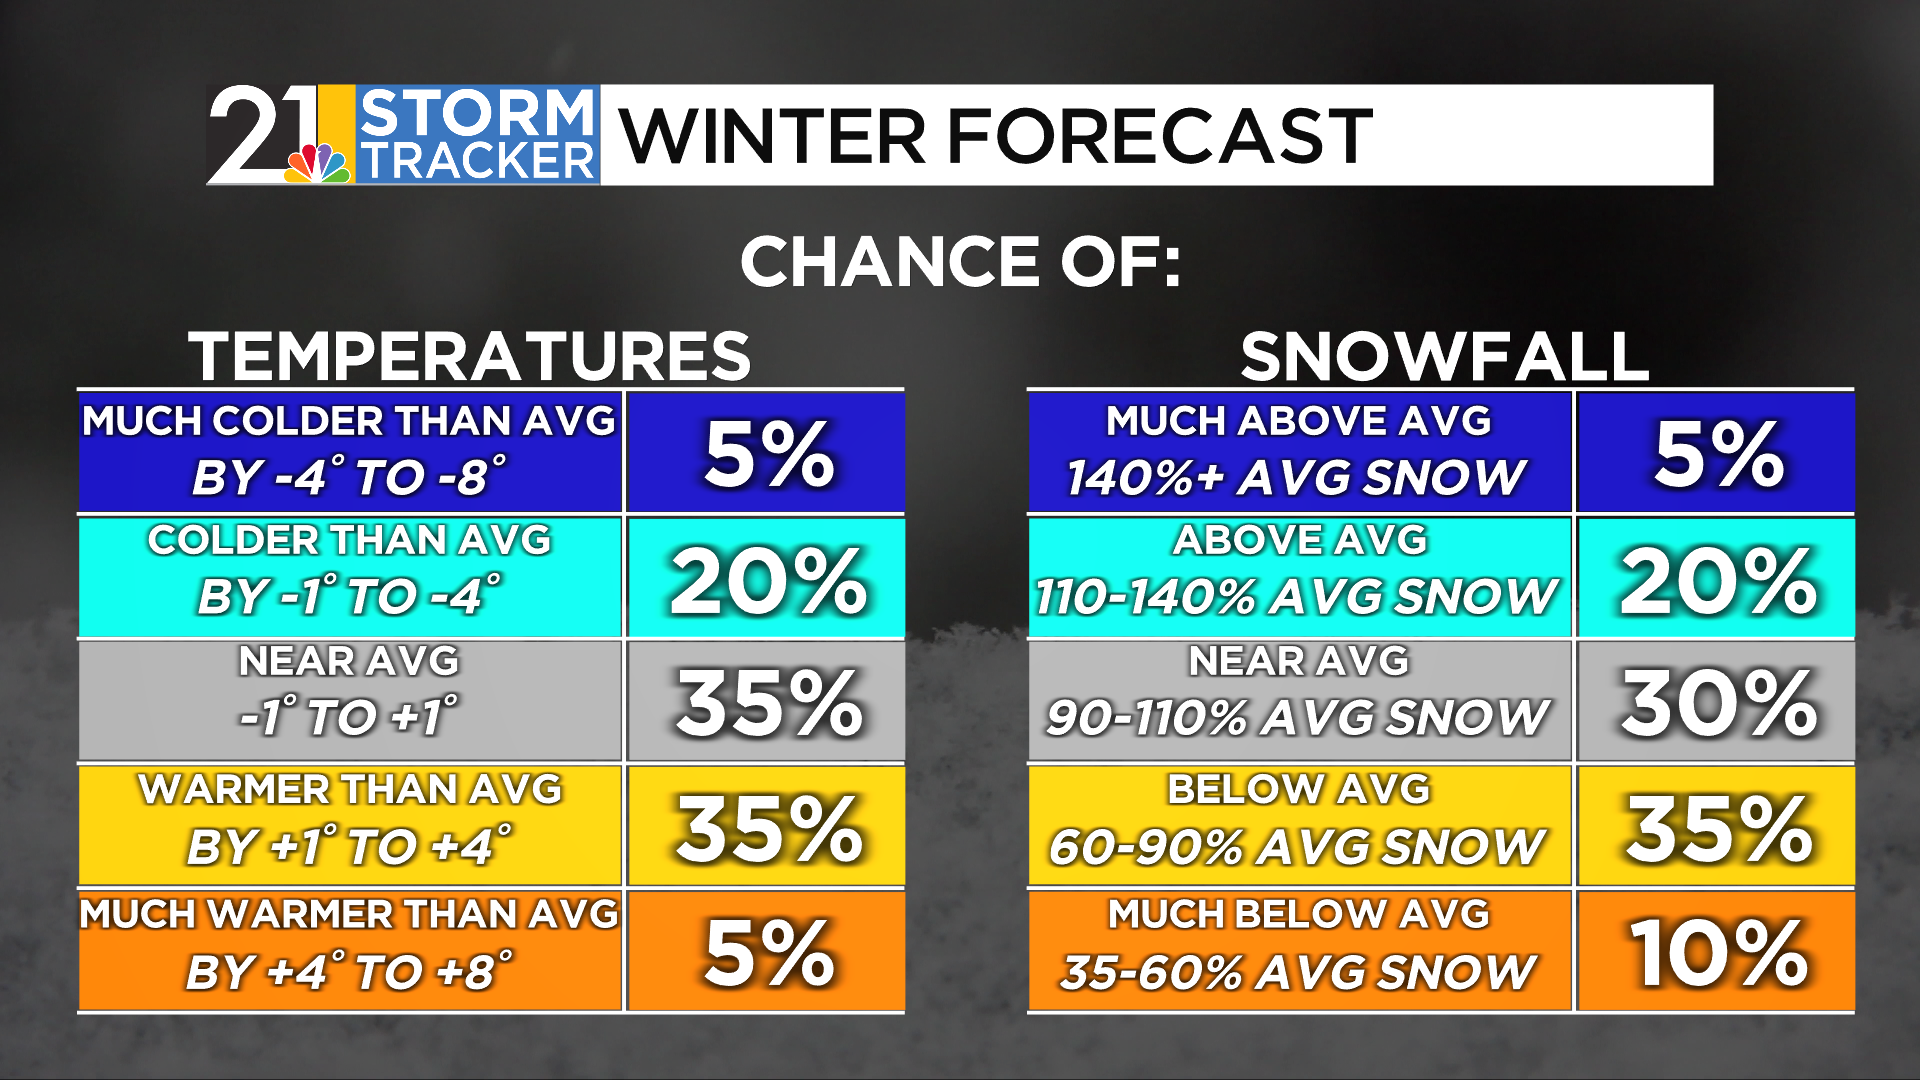
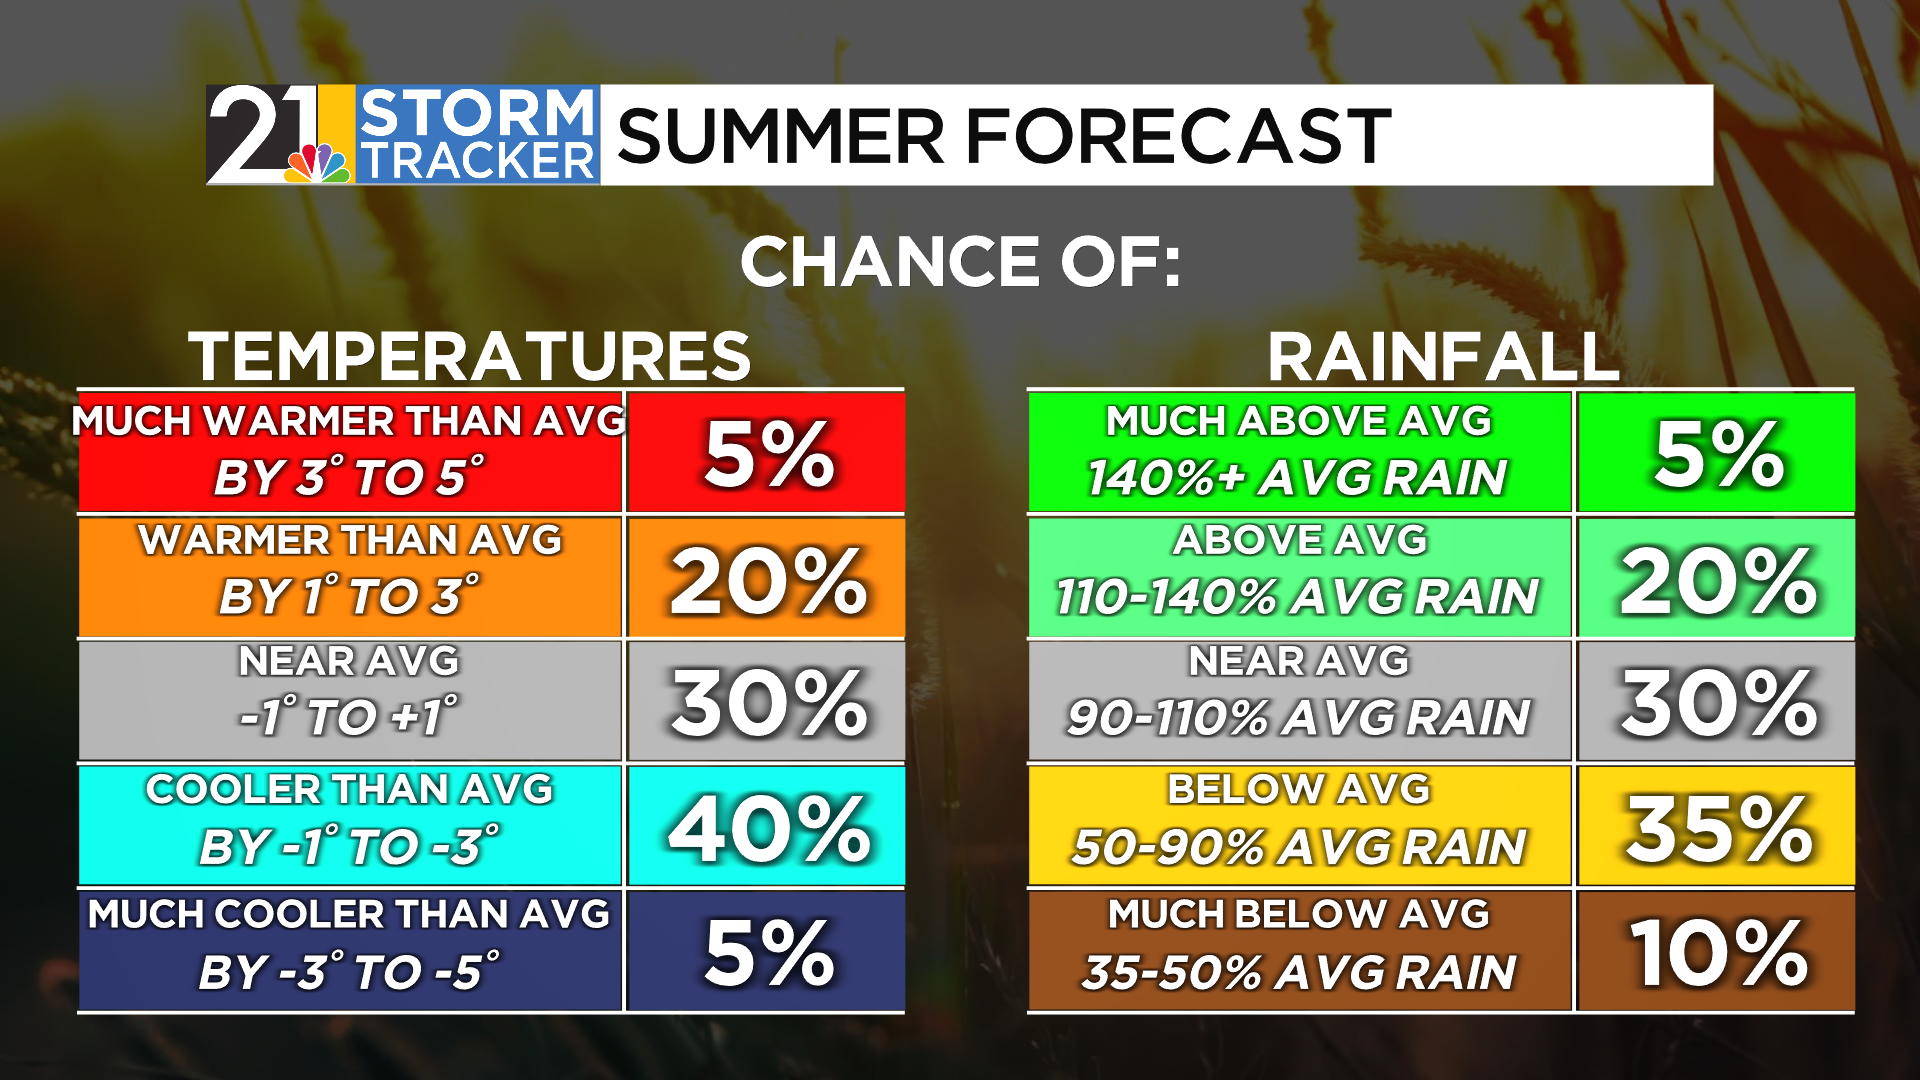
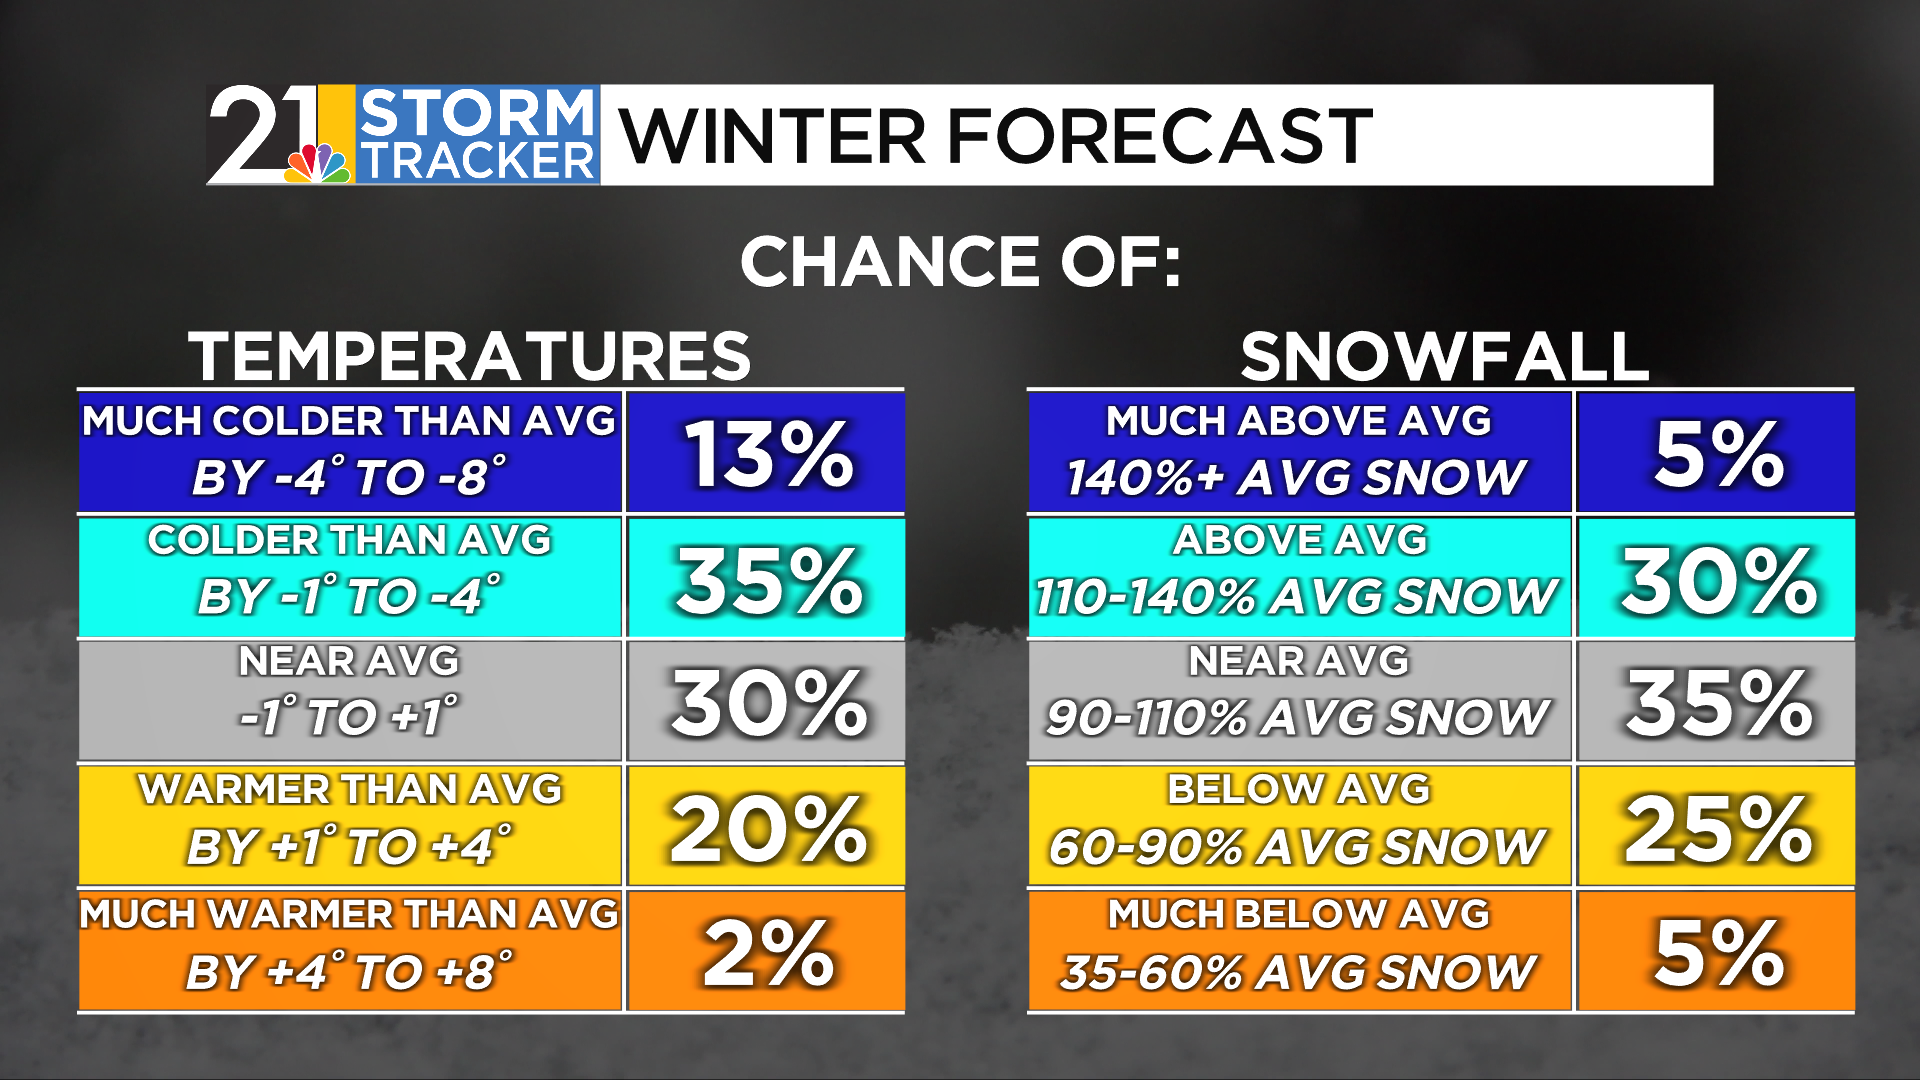
Odds of certain outcomes:

Does the forecast make you happy or are you ready for a good old fashioned cold and snowy season?