Climate Change: Making For Wetter Times In The Valley
THIS HAS BEEN A SOGGY SUMMER…WHAT GIVES??
As we hit the home stretch of “meteorological” Summer (the months of June, July and August), a common sentiment about this season’s weather has been:

It’s been soggy and stormy with fewer sunny and dry days than average. Not what most of us were looking for after a long winter of being cooped up inside. Not only has it been rainy in general but we have also seen a large number of severe thunderstorms and bouts of torrential rain over the last 2 months or so. We have seen more episodes of neighborhood flooding, especially in some particular “hot spots” such as Struthers, which we did a story on this week:
Forum planned Tuesday on flooding in Struthers - WFMJ.com
So is this part of a larger pattern? The answer is largely, yes.
THE CHANGING CLIMATE
If you’ve been following me/watching me for the last several years, you know I do not shy away from talking about climate change. Nor should I! While climate change information is communicated on local TV much more than it used to be, more TV meteorologists should be out in front on this issue. It’s real, it’s serious, it’s getting worse. These are established facts, no different than saying the Earth is round and that I have a mediocre golf swing.
In our region, the biggest impacts of the warming climate have come not from rising temperatures (although they ARE rising of course) but from increased precipitation. This will probably be the case for a while longer although unchecked climate change will eventually make our local temperatures more like present- day Alabama by 2100.
How does a warming climate lead to more precipitation? It’s pretty simple. Warmer air can “hold” more water vapor and an atmosphere with more water vapor in it can produce more heavy rain events.

Would some heavy rain events happen without climate change being a factor? Absolutely.. There’s some random chance involved. Barry Bonds would have hit many home runs even if he were not on steroids. But the fact that we was on the juice dramatically increased the ODDS that any given pitch would result in a home run. Climate change “loads the dice” so that extreme outcomes are more likely.

SOME OF THE NUMBERS
Through August 18, this has been the 5th wettest Summer (meteorological) on record for our area. Notice that 3 of the top 10 on this list are from the past 7 years.

Interestingly and perhaps counterintuitively, the release of the new 30-year averages earlier this year revealed that Summer is actually the season in which precipitation is increasing the LEAST in our area. August has seen the biggest jump out of the 3 Summer months so this wet August goes along with that.

9 of the 12 months of the year are wetter than they used to be and when we drill down to look at the frequency of “big” individual days, the trend is clear. While there is quite a bit of variation from year to year….the number of days in which we pick up 1” or more of rain is increasing.

WHAT CAN WE DO?
With the certainty that rain totals and flash flood events will continue to increase as the climate warms, individuals would be wise to take whatever preventative measures are in their power. Perhaps it’s time to invest in a sump pump. Make sure water flows away from your home.
Choosing to recycle, driving a hybrid, flying less….these are good, smart and noble things to do if you are capable. But let’s be realistic, they are drops in the bucket. Those concerned about climate change, whether it be because their basement tends to flood or because of the bigger picture concerns (fires, drought, extreme temperatures, etc) should make very careful choices about who to elect to positions of power and authority….both locally and nationally. Make sure your elected leaders believe in science, believe in facts and will advance a climate-friendly agenda. Voting is the best tool we as individuals have in this fight.
Are Thunderstorms More Rare Than They Used To Be In Our Area?
It’s been a quiet start to the severe weather season and today’s threat did not materialize for most of the area. Is this part of a long-term trend?
I received an interesting question from a viewer today. His impression was that we did not get as many thunderstorms in the Spring season as we used to. I have heard a similar sentiment from a few others. So is it really the case? Or is it largely “recency bias”, where our brains favor recent events over historic ones? Let’s look at some data.
NUMBER OF SEVERE THUNDERSTORM AND TORNADO WARNINGS ISSUED BY THE NATIONAL WEATHER SERVICE OFFICES IN CLEVELAND AND PITTSBURGH THROUGH MAY 26


Data goes back to 1986.; As you can see there is a lot of year-to-year variability. Cleveland averages 47 warnings through May 26, Pittsburgh 42. This year is obviously WAY below average (Cleveland issued their first warning of the year TODAY). Notice that while Cleveland has generally issued fewer warnings than average in recent years, Pittsburgh had above average warnings from 2017-2020.
Of course these offices cover a much larger area than just our TV viewing area and unfortunately county-by-county data is hard to come by.
BUT WE CAN LOOK AT THE AMOUNT OF THUNDER REPORTED AT THE YOUNGSTOWN-WARREN AIRPORT

Note the complete lack of thunder from January-March this year. April had less than average and May has seen WAY less than average. Part of a recent trend? Let’s look at 2020 and 2019.


2020 DID have a lack of thunder in the Spring season but that was made up for by a pretty active June and July. October was unusually thundery.
2019? Quite thundery. Most months had more than average.
SO, CAN WE DRAW ANY CONCLUSIONS?
This is just a “quick and dirty” look at some recent data. But I do suspect, as is often the case with weather, there is a fair amount of recency bias going on. I often hear in the winter/early spring: is it WINDIER than it used to be? The answer to that one is no, it’s windy at that time of the year every year. We live in a windy place from November-April.
That said, nationally there are some long-term trends revolving around severe weather. The most frequent destructive tornadoes are occurring farther east…not as often in the Plains states and more often in the Deep South. The nation has (thankfully) not had an EF5 tornado in several years, an unusual (and fortunate) streak.
What’s going on there, as is often the case with weather, is likely some mix of climate change and random chance/luck.
Wilhelm's Weather Why: All About Averages
Our weather averages are based on 30 year periods. Every 10 years that 30 year period shifts forward a decade. Now our averages are based on 1991-2020 and this shift has brought about some notable changes! This video takes a look at those changes.

Well, meteorological winter is, anyway.
Winter Review, Spring Preview!
A REVIEW OF WINTER 2020-2021
We meteorologists like tidy record keeping, which is part of the reason why we observe “meteorological” seasons. December/January/February comprises meteorological winter, so let’s dig into how the season went.
TEMPERATURES

The first 2 months of winter were pretty benign, temperature-wise. We did not have extreme warmth, no midwinter thaw. High temperatures were nothing t o write home about; we stayed below 50 during all of January. BUT, thanks partly to a very cloudy stretch, overnight LOWS were well above average during this stretch and that skews the numbers. Look at these temperature anomaly maps for January:

Temperatures (highs AND lows) compared to average

Low temperatures compared to average
Notice the deeper reds (warmer temperatures compared to average) for the low temperatures.
February of course was a much different deal. It was a tough stretch around here but this was truly a once in a generation cold snap for the nation’s midsection.

February temperatures vs. average
SNOWFALL
This season has certainly been snowier than last season and it’s been pretty much “back to normal”, with seasonal totals just a few inches above average so far. While little or no snow will fall from March 2-15, it’s not wise to bet against late-season snow around here. Case in point: last year when we had accumulating snow around Mother’s Day!

HOW’D THE WINTER FORECAST DO??
We make a big deal out of winter forecasts every year in late October/early November. A lot of effort is put into these things…I typically do several versions including a video that can run 15-20 minutes. So, did it may off? Did the forecast do well?
The answer is, yeah pretty well and MUCH better than last year. Everyone busted last winter.
I often mention that, while there is skill in seasonal forecasts and they do have value…they may actually be getting harder to do, thanks to the changing climate.

Here are the temperature maps I issued during that first week of November. For the first time, I took a “probabilistic” approach this year, assigning percentages to the various outcomes.


Locally, the idea that temperatures would be above average this winter worked out. Nationally, well the forecast was not as good, thanks to the deep freeze in February. The final verdict:

A much colder looking map for the winter as a whole. The thing is, we were well on our way to a very mild winter nationwide until the polar vortex disruption occurred in January and the effects of that shifted to our side of the globe in February. Unfortunately a “sudden stratospheric warming” event, which screws with the polar vortex, is not very predictable at long lead times.
With no polar vortex shenanigans, Februarys in moderate La Nina winters (and considering a few other variables too) are very often quite toasty.
ABOUT THAT POLAR VORTEX DISRUPTION
So what happened there? A “sudden stratospheric warming” episode is a naturally-occurring thing where unusually warm air at very high altitudes infultrates the arctic circle and “disrupts” the circular vortex that spins over the pole during the winter. Instead of a tightly-spinning vortex that keep most of the big-boy cold locked up over the pole, the vortex weakens and wobbles and bubbles of very cold air start spilling south. Think of it this way: take a coffee stirrer and swirl it around in your coffee cup. You get a nice whirlpool right? Stick your finger in there and the whirlpool gets disrupted (and your finger burns I guess).
In January, much of the cold landed in Siberia and Europe. In February it sloshed to the other side of the pole. In other words, here.

Despite not seeing the February deep freeze coming, the overall “jist” of our forecast was correct; snowier than last year and not quite as mild. This graphic worked out well:


WHAT ABOUT SPRING?
Despite the chill we will have for most of the next 5-6 days, March overall should be wayyyy different than February. We’ll probably see 60+ degrees at least once or twice next week and the month overall should end up being a fair amount warmer than average. It’ll likely be on the damp side.


The overall Spring forecast looks pretty similar: we will likely have plenty of precipitation but overall a mild season compared to average.


SEVERE WEATHER SEASON
It is likely to be a pretty active severe weather season in much of the country east of the Mississippi, including around here. Does this mean we should do anything different to prepare? No. Everyone should take some time this Spring (and every Spring!) to review their plans for sheltering in the event severe weather strikes. How are you getting your warnings?
EVERYONE SHOULD HAVE MULTIPLE WAYS OF RECIEVNG SEVERE WEATHER INFORMATION. ONE SOURCE IS NOT GOOD ENOUGH.
Do not, do not, do not, rely on tornado sirens as your first line of defense. They are not designed to be heard indoors and are unreliable. Have Wireless Emergency Alerts enabled on your phone. Make sure push notifications are enabled on your apps, including the StormTracker 21 app.
And perhaps most importantly, INVEST IN A WEATHER RADIO! It’s like a smoke detector for weather alerts. It just works. It’s not dependent on cell phone signals. It can run on batteries. They are cheap and easy to find.


Winter Is 2/3 Over But Is Really Just Beginning
Welcome to February! The winter has been tame for the most part. February won’t be.
Meteorological Winter is the months of December, January and February. Now that we are into February, we are technically in the “home stretch” of the season. Let’s review what the season has looked like so far and look ahead to February.
TEMPERATURES SO FAR:

Temperature anomalies in December/January
It’s been a mild winter so far here in eastern Ohio and western Pennsylvania. In fact, you have to squint to find ANY cooler-than—average temperatures in North America so far. Was this expected.
Yeah pretty much. Here' was our original winter forecast “most likely outcome” map.

The only significant “miss” with this forecast is up in Canada where there should have been absolutely no blue. The Deep South hasn’t been as mild as expected.
SNOW SO FAR:
Despite the lack of significant cold, it HAS been a reasonably snowy season so far. Much of our snow was in December as January was quiet until the month’s final hours. At the YNG airport in Vienna, we are above average and quite a bit above last year’s total through February 1:

WHAT ABOUT FEBRUARY?
As recently as a week to ten days ago, the overall idea for February was that the month would start fairly mild and then colder regimes would win more battles starting around mid-month.
OOPS.
Now it is obvious that the pattern will be quite cold and stormy for a while as the month gets going. How can a forecast change so significantly?
The pattern in the northern Atlantic has actually been favorable for cold in our region for quite some time. But the atmosphere over the Pacific has not been playing ball, resulting in cold shifts being pretty lame and fairly transient. The BIG BOY COLD has been on the other side of the pole in places such as China and Siberia.
But that’s about to change. Clusters of tropical thunderstorms in a key part of the Pacific (known as the “Madden Julian Oscillation”) will migrate into an important zone. This has effects downstream, such as pumping up a ridge of high pressure off the West Coast of the US. In turn, a trough can really dig into central North America. With the favorable north Atlantic blocking, the stage is set for cold to come and lock in for a time.

This is pretty complicated stuff but always interesting to see how everything in our beautiful atmosphere is connected. Computer modeling, including the heralded European model, have been doing a poor job handling these features in the Pacific, leading to poorer-than-average forecasts in the 2-4 week range across North America.
BIG BOY COLD
After a modest warm up during midweek, a cold front will arrive Friday morning, leading to a blustery and cold afternoon. But that’s just a teaser. The cold that’s coming early next week is easily the harshest of the season and has a good chance at being the coldest weather we have had in a little over 2 years.


If we get below zero it will be the first time since the end of January 2019.

How cold we get at night will depend some on cloud cover. If we get a clear sky and relatively light winds, look out below. It won’t take much of a breeze to create some pretty nasty wind chills. These are model projections but seem reasonable at this early stage of the game.


Given the way the first half of the month looks, it seems reasonable that odds favor the first colder-than-average February for our area since 2015.

I suspect it’ll be a pretty snowy month too.

THINGS TO LOOK FORWARD TO
The days are getting longer and this week begins the 3 month stretch on which we gain daylight at the fastest rate. Hooray!


The Winter 2020-2021 Forecast
A RETURN TO FORM OR ANOTHER WINTER DUD?
Welcome to the 2020-2021 winter forecast for the WFMJ-TV viewing area, namely far eastern Ohio and western PA. This is the “written” version of the forecast; if interested, be sure to check out the video version as well.

FIRST, LET’S BE CLEAR, WINTER FORECASTS LAST YEAR STUNK.

Meteorologists everywhere last winter.
Cruise around the internet and you can find a lot of seasonal forecasts, some by reputable TV meteorologists, some by NOAA’s Climate Prediction Center, some by forecasters with private firms and some by hobbyists. With few exceptions, the outlooks for winter 2019-2020 were a bust. My forecast belongs in this category as well although I will say that I did not have AS cold of a forecast as many I saw. But it was still off the mark. Last winter was a “blow torch winter” with all three months (December-January-February) being warmer than average by fairly large margins:

December

January

February


How did this happen? I mean, we do know what we are doing? RIGHT?? Well yes, for the most part those who create these outlooks have a (varying) level of expertise. But the atmosphere is extraordinarily complex and long-held assumptions and beliefs about this complex system are being challenged more and more by climate change.
In addition to the rapidly changing climate, a rare event occurred all the way over the Indian Ocean last fall/early winter that I believe created a domino effect across the Pacific, North America and the Atlantic that loaded the dice in favor of warm weather. This is called the Indian Ocean Dipole (IOD) and it was very VERY “positive” a year ago.

This led to a terrible drought and wildfires in Australia but the IOD’s impacts likely extended much farther east. A very strong IOD can also impact air circulations much farther east, and, in the absence of a strong El Nino or La Nina in the Pacific, these circulations can become the “boss”, lining up all the right players for warm winter weather in eastern North America. Many forecasters have little/no experience with the IOD, let alone such a strong one. It’s quite possibly the chief reason for some many bad outlooks last year. The IOD is not expected to be much of a player this year.
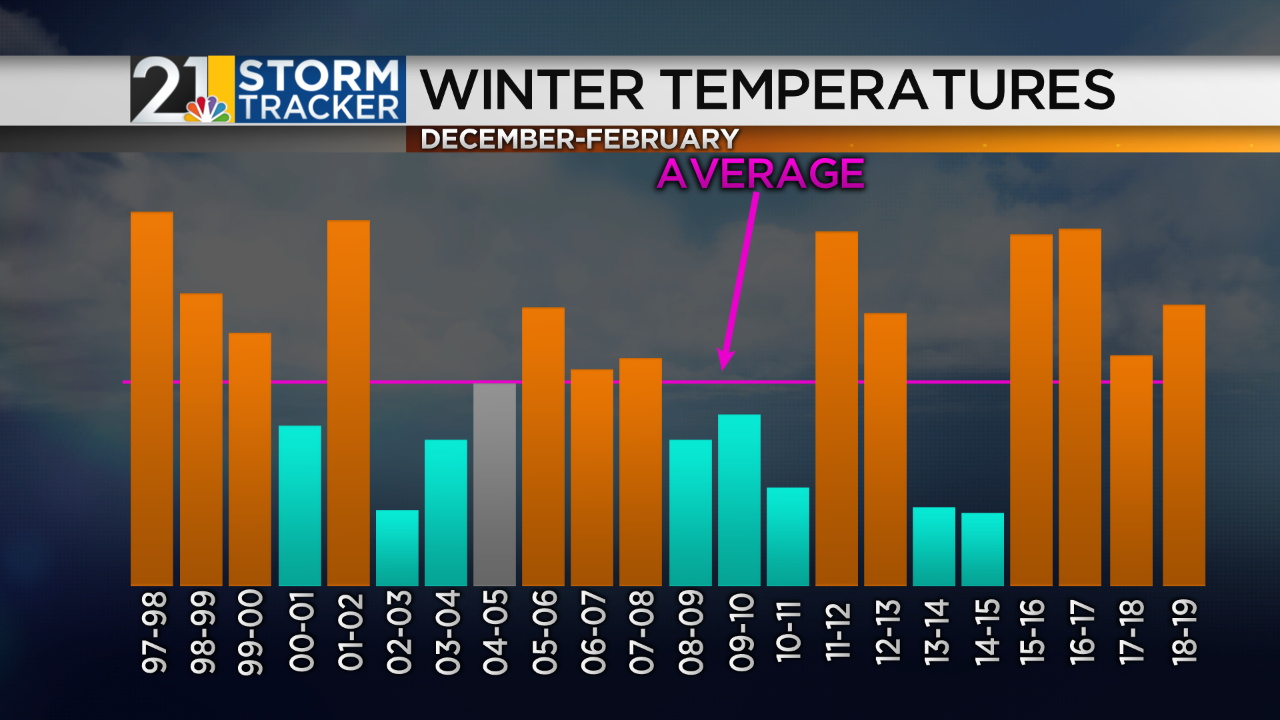
RECENT WINTERS IN OUR AREA
After a couple of tough winters in the middle of last decade, we have now reeled off 5 straight balmy winters (with 2017-2018 being the closest to average).

While precipitation has ben plentiful, snowfall has NOT been over the last 2 winter seasons. 3 of the last 5 have been “dud”s.

SO AGAIN, CAN WE DO THIS???
Let’s get back the subject of the skill in these forecasts. Do they have as much skill as the standard 7-day forecast that you find on the StormTracker 21 app or on 21 News? No way. But here IS skill in this. It’s not “guessing” or throwing darts. But unlike the rising skill of short-term forecasts, it can be argued that we are in the middle of a difficult period where climate change is likely REDUCING the skill of these forecasts by some amount. Some years (last year) it will be more than others.
Why? Well a big part of the “secret sauce” of creating a seasonal forecast is “analogs”; years in the past with similar ingredients in the oceans and atmosphere to this year. Ocean water temperatures are a very big part of this and, simply put, the oceans are on fire. The amount of heat in the oceans is not something we have analogs for and this heat content is undoubtedly making the atmosphere do things that we do not understand well just yet. Look at the current water temperature anomalies across the globe. With the exception of a tongue of cold water in the Pacific associated with La Nina, it’s hard to find much blue.

In addition to analogs, we depend some on computer models and some on stuff that’s a little less science-y like gut feelings, experience, etc.

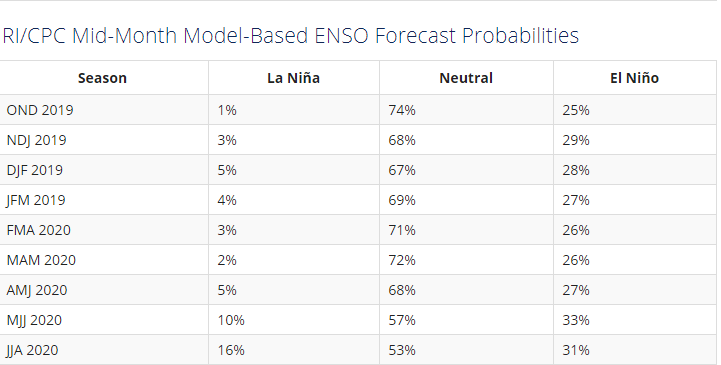
LA NINA: THIS YEAR’S MAIN INGRIDIENT
La Nina. It’s the cooling of the waters in the equatorial Pacific, especially the eastern Pacific. It’s the opposite of El Nino. We have a pretty strong one on our hands this year, probably the strongest Nina in a decade. Some models suggest that water temperature anomalies will get close to -2 degrees Celsius, which would be quite rare.

A “typical” La Nina results in a weaker subtropical jet stream and a stronger northern branch of the jet. In the US, this can lead to a dry winter in the southern parts of the country and more frequent precipitation in the northern tier of states.
But not very La Nina is created equal. Some weaker ones can be overwhelmed by other factors. A stronger one can exert it’s will and it’s impacts can become more predictable.
THE QUASI-BIENNIAL OSCILLATION
This is a much less well-known ingredient in the winter casserole. The “QBO” refers to a zone of very high altitude winds over the equator. How high? We are talking about the stratosphere here. This river of fast-moving air changes direction every 14-16 months. The QBO can impact large-scale circulations in the northern hemisphere winter. The polar vortex tends to get dislodged more frequently in “easterly” or “negative” phases of the QBO. A dislodged or perturbed vortex then can meander off the pole and if it meanders into the western hemisphere, we can get cold shots more frequently. The opposite is true of the “westerly” or “positive” phase of the QBO; odds of a meandering polar vortex are lowered.
We will see a “positive” QBO this winter.
THE SUN REMAINS “QUIET” BUT IS WAKING UP
We are emerging from a “solar minimum”, a period in which the sun is “quiet” with little sunspot activity. This is a cycle that repeats itself about every 11 years. So what? There is some research that shows a correlation between low sunspot activity and COLD winters in the eastern US, but honestly I think the relationship is shaky. If there are strong pattern drivers (last year’s IOD, strong El Nino’s, La Nina’s etc) I suspect the solar cycle is not particularly important. Worth a quick mention though.

THIS YEAR’S ANALOGS
Ok let’s start getting into the forecast. As mentioned above, analogs are becoming tricky, especially because of the significantly warmer oceans that we have now. Any years before the late 90s can almost just be thrown out at this point. Much more “weighting” should be placed on recent years that are a good match.
Based on the intensity of La Nina and the other factors discussed above, here are my analogs for this winter. #1 is 2016-2017. It’s a recent year with similar heat content in the oceans. But it’s far from perfect as the La Nina that winter was a fair amount weaker than this time.

The 2016-2017 winter was quite warm but snowfall was actually a little above average. Here’s a look at the national temperature map that winter:

2016-2017 winter temperatures
2010-2011 is actually a pretty good match for La Nina strength, the QBO phase and low solar activity. It was quite a bit different though! Very cold and actually our snowiest winter on record(!). BUT looking at the oceans globally, while it is a good match in the LA Nina zone, there was much more cool water elsewhere, most importantly in the northern Pacific. Also important is the very warm water in late 2010 near Greenland and the lack of significant warmth of the East Coast of the US. So while we have to keep this analog year in mind, I think the chance of a repeat of 2010-2011 this year is pretty low.

Late 2010 ocean temperature anomalies

Late 2020 ocean temperature anomalies
When you throw all the analogs in the hopper, with particular emphasis on 2016-2017, you get a composite map that looks like this:

Precipitation:

THE COMPUTER MODELS
Meteorologists have access to a treasure trove of computer models these days. Some only predict the state of the atmosphere 12 hours out in time, some a week and some on a seasonal time scale. Of course, the accuracy and reliability of seasonal models is less than the short-term ones but they still have value. It’s another tool in our tool belt. Just like a hammer is not going to build a deck for you (YOU have the USE the hammer correctly!), the models do not build the forecast.
So that being said, one word describes the look of the seasonal models at this point: WARM. All of them are factoring in the strong La Nina and suggesting it will be quite balmy in the eastern 2/3 of the country. For example, the European model seasonal outlook for winter:

We have to be careful with the European, as it has a hard time “seeing” cold on the seasonal scale. I very much doubt the winter is warmer than average across the ENTIRE lower 48 states. The Euro precipitation outlook is pretty classic La Nina stuff:

THE FORECAST
“Don’t bore us, get to the chorus!”.
Ok, after all that, let’s talk about the actual forecast. Given all that I have said so far, it would be pretty shocking if my forecast was cold and snowy, right? Well, don’t worry it is not. I expect this winter to be another relatively “easy” one by Ohio/PA standards. BUT! That does not mean we won’t have bouts of cold and snow. And I do think odds favor at least 1-2 “BIG” storms this season even though snow events may be quite infrequent.
I’ll break down the temperature outlook by likelihood.
THE MOST LIKELY OUTCOME: A WARM WINTER OVERALL IN MUCH OF THE COUNTRY; LOCALLY A SIMILAR FLAVOR TO THE LAST 5 YEARS.

THE NEXT MOST LIKELY OUTCOME (ALTHOUGH WITH SIGNIFICANTLY LOWER ODDS): A VERY WARM WINTER, LOCALLY PERHAPS EVEN WARMER THAN LAST YEAR. A TOP-5 WARMEST WINTER ON RECORD FOR US.


OUTCOME THAT CANNOT BE RULED OUT: A WINTER THAT IS NOT SIGNIFICANTLY COLD BUT CLOSER TO AVERAGE THAT MOST OF THE LAST 5 WINTERS.

I would be pretty shocked if the national temperature map ended up any colder than this, especially for our area. A wager on a cold winter locally would be very very risky at this point.
Precipitation forecast:

It does seem like it will be pretty wet winter. Because above-average precipitation is expected, when things DO come together just right, a SIGNIFICANT snowstorm will be a possibility at times this year. The odds of a couple of “big ticket” storms may even be higher than the last couple of years, despite the warm forecast overall. The FREQUENCY of snow events may be rather low, however.
THE SNOW FORECAST:


Average seasonal snow
FORECAST CONFIDENCE
As shown above, we think there’s is about a 60% chance of the kind of winter that has been common in recent years; warmer than average. Beyond that, a 1 in 4 chance of it being VERY mild…to the point that it can be one of the warmest on record. We are confident that a colder-than-average winter will not occur. Overall, we have high confidence in the drivers of the pattern….the moderate/strong La Nina, the positive QBO, etc. Confidence is reasonably high that it will be an unsettled winter with plentiful precipitation. Where confidence is not that high….the snow. This may end up being a season with snow totals within shouting distance of average but it may be PERCIEVED as pretty snowless because of the long intervals between snow events. Expect a lot of cold rains, snow changing to rain situations and maybe even some rare wintertime thunderstorms when the pattern gets real warm.
WHAT COULD GO WRONG?
All forecasts carry inherent risk; this is tricky business. Where is the bust potential this year? The forecast is likely to be not-warm-enough at this stage rather than too warm. But how could this end up being a colder and snowier winter?
1) The unusual temperature patterns across the oceans produces outcomes that have low predictability.
2) The polar vortex has unexpected weakening episodes and decides it wants to take a stroll on this side of the world rather than staying parked over the pole.
3) The Great Lakes remain unfrozen/unusually warm and we get enough cold shots, especially early in the season, that sizeable lake-effect snow events occur, driving up snow amounts (especially in areas north of I-80).

THIS WINTER VS. LAST WINTER
Compared to last winter, this winter is most likely to be pretty similar temperature-wise but somewhat snowier, thanks to a higher chance for “big ticket” events. Caveat: The number of days in which it snows? Likely below average.

THE BOTTOM LINE

AN UPDATE TO THE WINTER FORECAST WILL BE ISSUED IN EARLY DECEMBER!
Putting The Upcoming Heat Wave Into Perspective
THE HOTTEST STRETCH IN 67 YEARS?
It’s been a very warm week but we have not really even gotten started with the heat. The upcoming pattern will not bring any daily record highs to our area BUT it will be notable for it’s LENGTH. Our current forecast calls for EIGHT consecutive days with highs of 90+. A string of 90+ degree days like this has not been seen for a while. A long while!

Can we get to 8 straight? Saturday, July 4th may be the wild card. I can see where will fall just short of 90 that day. A stray thunderstorm that moves over the airport early in the afternoon Wednesday and/or Thursday could short circuit the warm up those days. But the odds are low at this point.
The Valley averages 8 90 degree days in an entire year so it would be quite something if we reel off that many in a row. We have had 2 such days so far this season.
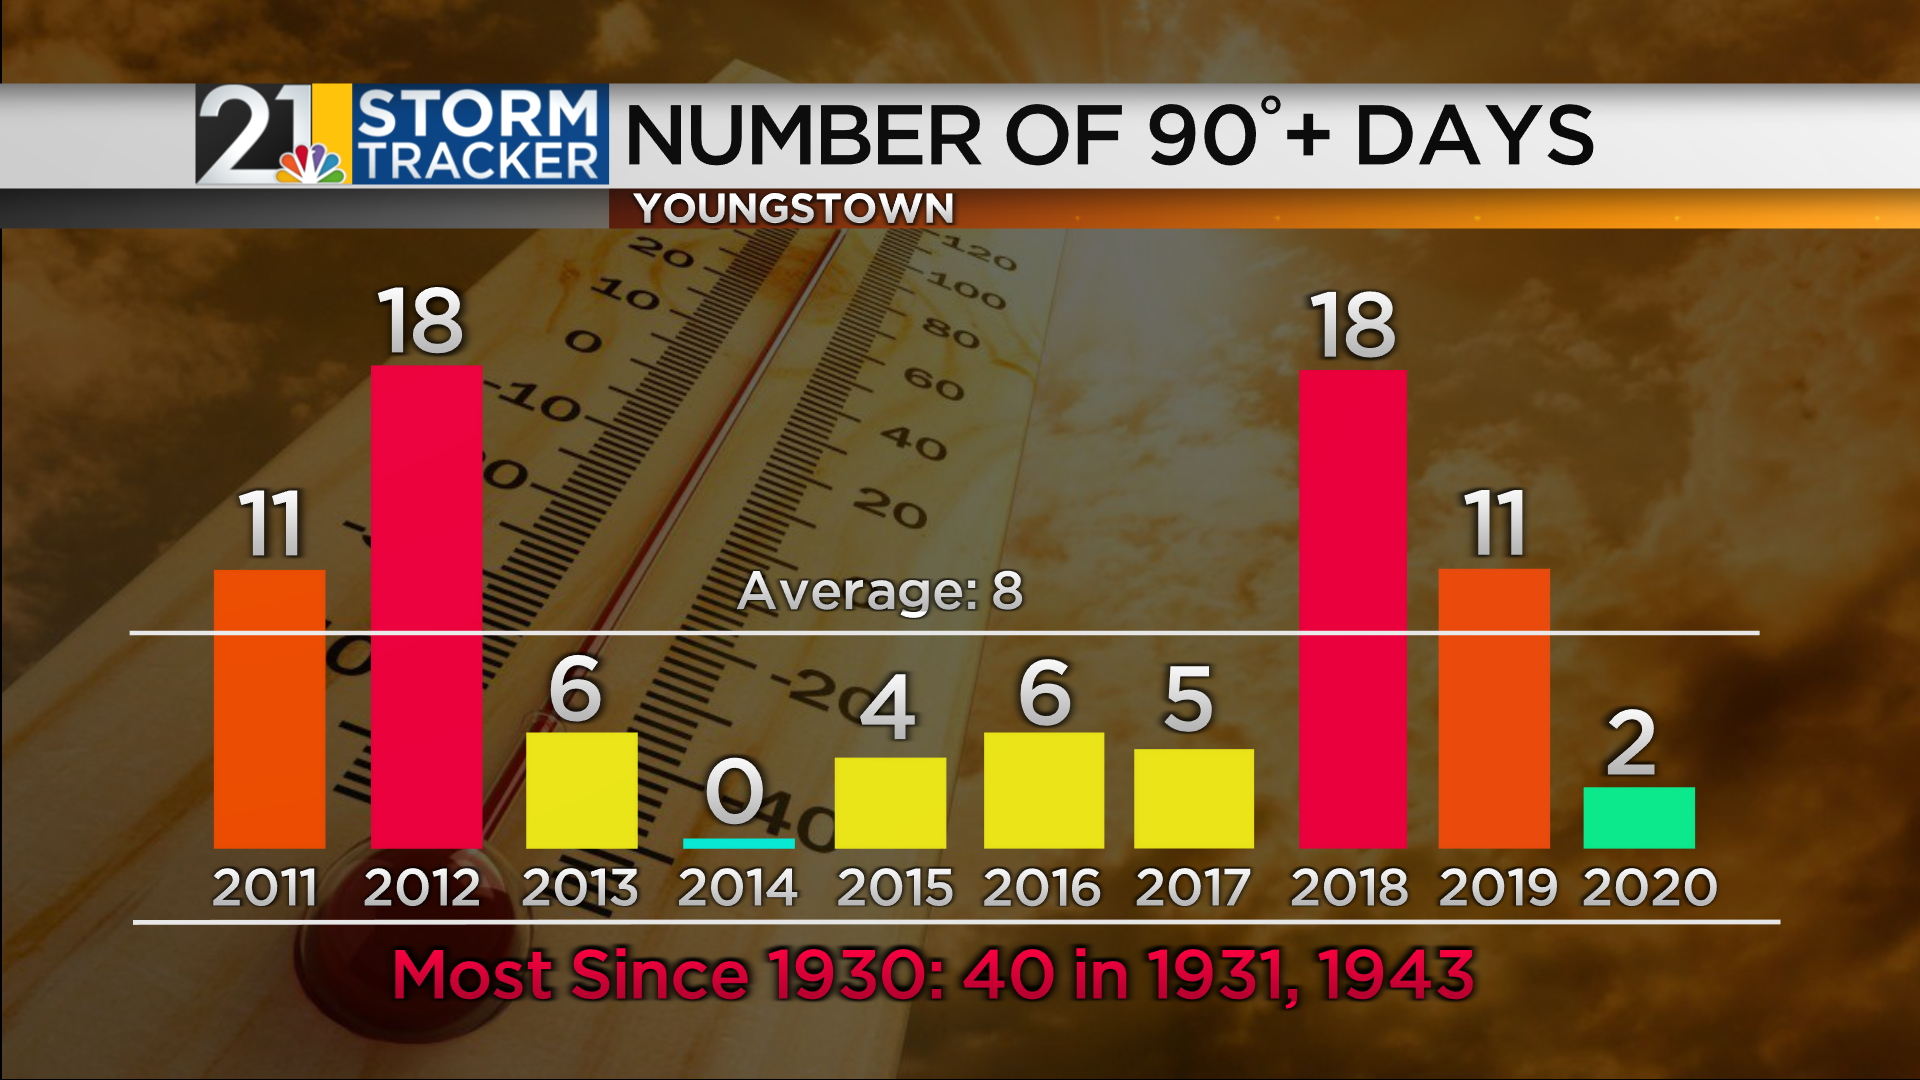
A temperature above 92 has been very hard to come by of late. Last year we hot 91 several times and 92 has been achieved a handful of times in recent years. But the Youngstown-Warren Airport has not seen a temperature of 93 or above since the scorching hot July of 2012.

As I mentioned, it is unlikely that any daily records will be challenged during the upcoming stretch. The daily records in early July are all in the upper 90s and 100s. It is interesting to see how infrequently these lofty numbers occur here. Temperatures above 95 are especially rare. This is why experienced meteorologists rely on their knowledge of local climatology. Some models would have you believe that upper 90s are possible early next week, but it’s not usually wise to bet against history. Especially since we are not in a drought (yet), which can lead to higher odds of extreme heat .

Lightning Safety Awareness Week-What To Know About Lightning
Lightning is one of the most fascinating aspects of meteorology and the atmosphere in general. It’s also a subject of intense interest and we have much to still learn!
It is Lightning Safety Awareness Week and so I thought we’d take a minute to talk about this amazing-but dangerous-phenomena.
HOW DOES LIGHTNING FORM?
Lightning is the result of stuff running into each other within clouds. Just like rubbing your shoes on the carpet can produce a charge, especially when it’s a dry winter day, static electricity happens in clouds as ice and hail collide.


As shown above, a lot of lightning stays “in the cloud”. Cloud-to-ground lightning is the next most common type of lightning. A special type of cloud-to-ground lightning, containing a positive voltage, is rarer but quite a bit more dangerous because it carries a higher voltage, can travel farther distances and can sometimes be a “bolt from the blue”….striking the ground in a location FAR away from the thunderstorm.

WHEN THUNDER ROARS, HEAD INDOORS
When we talk about staying safe in a thunderstorm, this is a phrase we use a lot. Why? Because if you are close enough to hear the thunder, you are close enough to be struck by lightning. The actual storm may be several miles away, but as I said, lightning sometimes will leap out of an anvil cloud and strike the ground several miles away.
You can estimate how far away a storm is by doing some math. Sound travels at 767mph on average although the density (and therefore temperature) of the air can slow down or speed up the sound of the thunder. Warmer air is less dense and so the sound can cut through the air faster.

A good rule of thumb is that the lag time between seeing lightning and hearing the thunder is 5 seconds for every mile. Again it can vary slightly depending on the temperature of the air.
“HEAT” LIGHTNING: NOPE
“Heat lightning” is one of those weather myths that I get a kick out of debunking because people are often very surprised that IT IS NOT A REAL THING. Some will even argue with me (not as much as when I rant about tornado sirens, but that’s a different story").
What is “heat lightning”? No it isn’t lightning that just magically occurs because it’s hot. It’s simply lightning from a distant storm. So distant that you can’t hear the thunder that the lightning produces. Light travels MUCH farther than sound! It’s not uncommon to be able to see lightning from a storm that’s 50-100 miles away if conditions are right.
Because of the curvature of the earth, often we can only see the top of distant storms. So we are seeing the lightning illuminating the top of that storm.


WHO GETS STRUCK BYLIGHTNING?
Thankfully, the odds of being struck by lightning are low; about 1 in 15,000 during your lifetime. BUT it does happen and it can be prevented. The majority of lightning victims are struck while doing something involving WATER. Boating, fishing, swimming, at the beach, etc.
No surprise, 80% of victims are men. Why? Well a lot of these activities are dude-centric. Also: men are generally more, shall we say, stubborn about cutting an activity short as a result of threatening weather.

According to the company Vasalia, Ohio and Pennsylvania are in the middle of the pack when it comes to lightning deaths per capita.

It's Severe Weather Awareness Week: Let's Talk About It
IT’S SEVERE WEATHER AWARENESS WEEK IN THE STATE OF OHIO
In our current situation, the last thing anyone wants to be stressed about is the weather. But it IS Severe Weather Awareness Week, the week that we talk about all aspects of thunderstorms, flooding and tornadoes. This includes some reminders on what to when threatening weather is in our area.
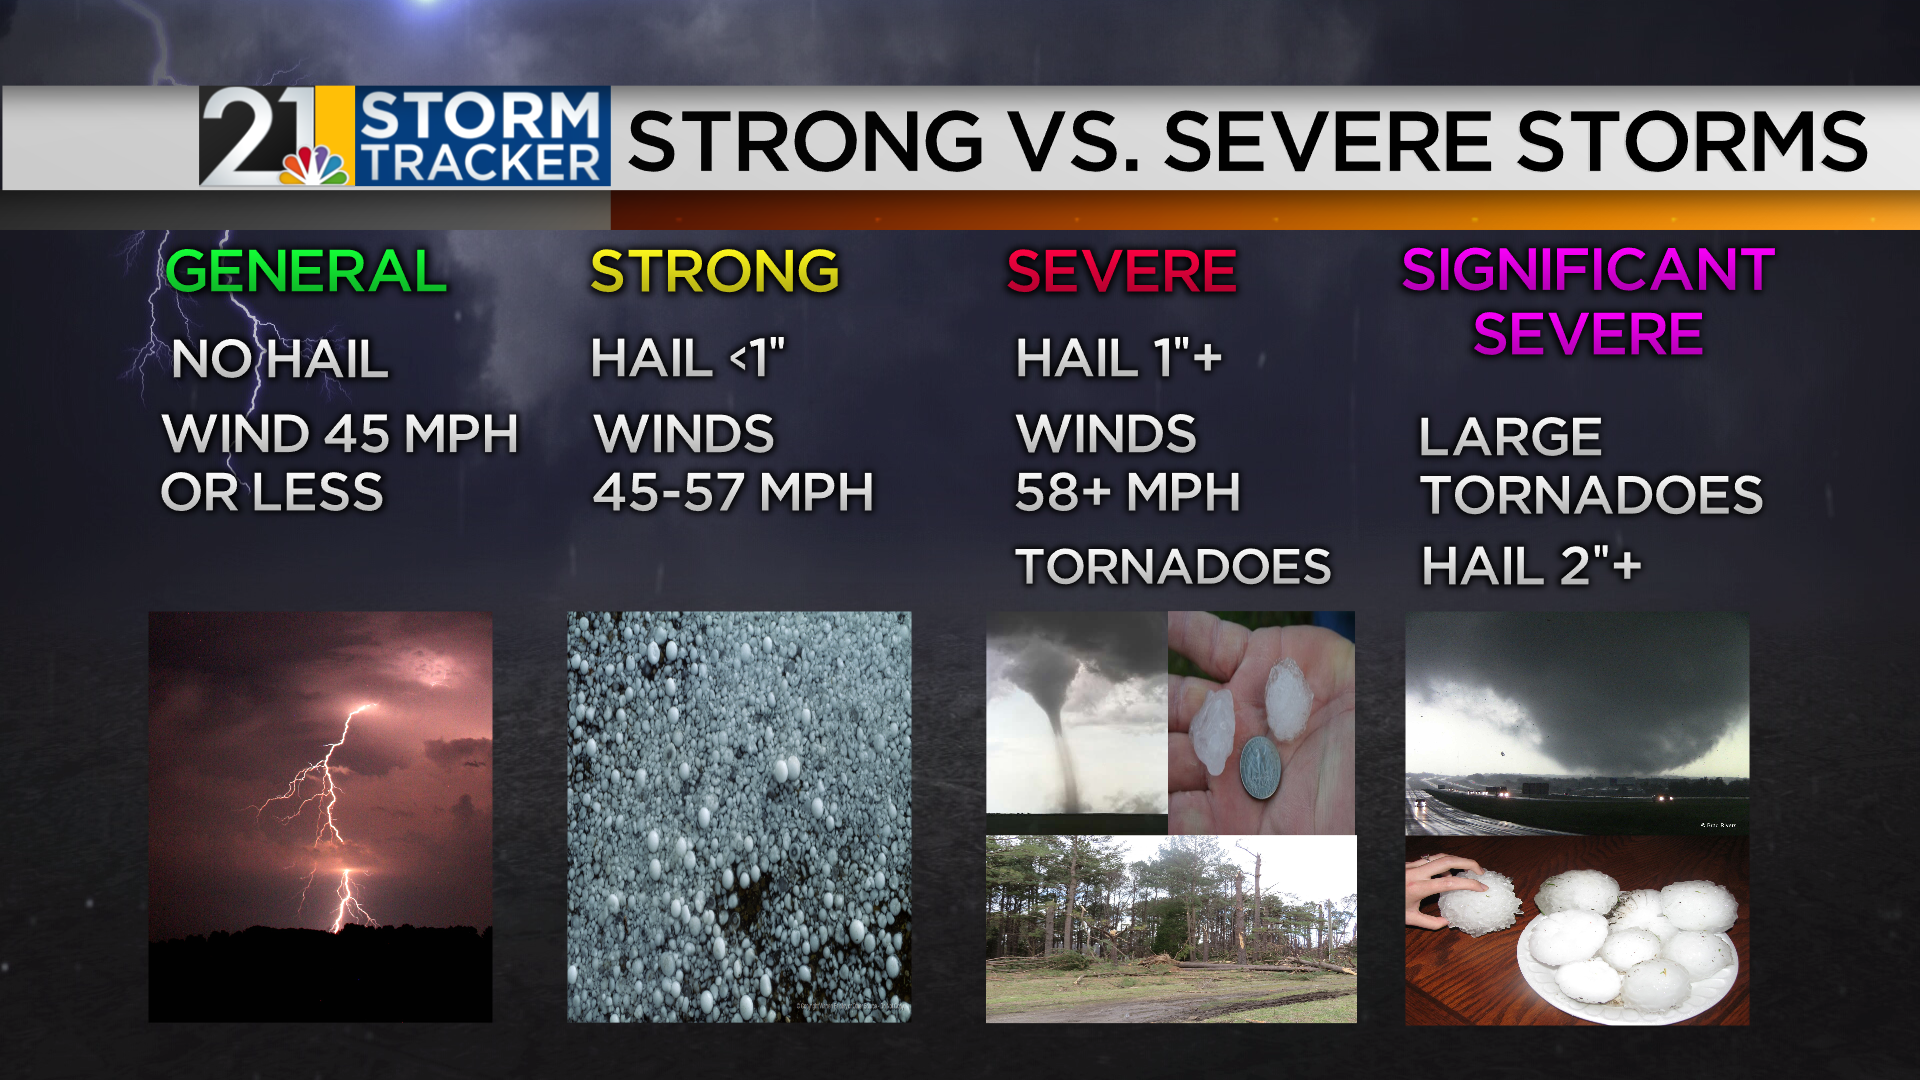
WHAT IS A “SEVERE” THUNDERSTORM?
Any thunderstorm can be dangerous, but a “severe” thunderstorm does have a definition. Interestingly, amount of rain and frequency of lightning are not included in the definition. A storm is severe if it is producing large hail, very strong winds and/or a tornado.
WATCH VS. WARNING
Two of the more basic severe weather terms but they do trip people up. A Watch means conditions are favorable for some sort of severe weather. A Warning means that weather is occurring or about to occur. Put another way, a Watch means the ingredients are there. When you have sugar, flour and icing, it’s a Cupcake Watch. When those ingredients come together to make a cupcake, it’s a Cupcake Warning. Put another way:

TORNADOES
Tornadoes, thankfully, are pretty rare in our area….but they do happen. All the tornado touchdowns in our area since 1950:

Tornadoes can occur at ANY time of year (in 2019 we had a few in JANUARY) but our “tornado season” typically is thought of as late spring and early summer. Notice how the peak tornadic activity shifts closer to our area in May and June:


How do tornadoes form? It’s all about wind shear and instabilty. Wind shear is the change in wind direction and/or speed with height in the atmosphere. Instability is the ability for air parcels to rise quickly.
There are more myths about tornadoes than most other types of weather. Here are just a few:

How to stay safe when a tornado threatens? A basement is best but if you do not have one, find an interior room with no windows….you wan as many walls between you and the outside as possible. Live in an apartment building. Make friends with your first floor neighbors. Live in a mobile home? Have a plan for escaping that structure when severe weather threatens.

TORNADO SIRENS: STOP.RELYING.ON.THEM.
Time for my annual tornado siren rant. It’s 2020 and very VERY few people should be relying on World War 2 technology to alert them of severe weather. They are NOT designed to be heard indoors. They are not dependable. Local officials do not use the same guidelines for activating them. Need I go on?
Have a weather radio, have push alerts on your phone activated, pay attention to the TV and social media. But do not DO NOT base life-critical decisions on whether you do or do not hear a siren. Don’t be the commenter on my Facebook page who says “but I didn’t hear a siren!”. When I created the graphic below, I saved it as “SirensStink”. Enough said.

HAIL
Hail is much more common in our area than tornadoes but IMPACTFUL hail is fairly rare. Pea-sized hail does not hurt anything and usually we don’t see damage to cars and building until the hail is at least the size of quarters. That’s much more common across the Plains states but does occasionally happen here. Large hail can be particularly destructive if it’s accompanied by strong winds. That can blow those big stones into the side of your hours, breaking siding and windows.


LIGHTNING
Lightning is very dangerous and has to be taken seriously. “When thunder roars, head indoors”. If you are close enough to hear thunder, you are close enough to be struck by lightning. Most lightning victims are male and many fatalities occur near or on water.

Lightning can have either a positive or negative voltage. All lightning is dangerous by lightning that has a positive voltage, while less common, is particularly dangerous. Positive strikes have a higher voltage and tend to hit objects more often. “Bolts from the blue”, or strikes a long distance from the thunderstorm, are almost always positive voltage strikes.


Remember: “Heat Lightning” is not a thing! It’s just lightning that is too far away for thunder to be heard. Lightning can be seen up to 100 miles away but thunder can only be heard about 10 miles away.

FLOODING
Flooding is an “underrated” aspect of severe weather. Tornadoes and hail and lightning are “sexy” but flooding impacts more people (by far) annually. We’ve had big flooding problems in our area over the last couple of years. Climate change loads the dice in favor of more frequent extreme precipitation events. That does not mean they will occur every year but they will likely occur with more frequency than before man-made climate change became such a huge issue.

STAY SAFE!
Being prepared is the key to you and your family dealing with severe weather. Have a plan and make sure the kids understand what it is. This includes what part of the house to go to. A bike helmet is a great idea for protecting heads. Again, make sure you have MULTIPLE ways of receiving warnings and other important weather information. Use TRUSTED sources.


21 NEWS SEVERE WEATHER POLICY
When severe weather threatens, we are your go-to source of critical weather information. Just like every other station in the country, when there is an active Tornado Warning anywhere in our viewing area, we will be live on TV. No matter what show is supposed to be on! Often extended coverage on TV leads to complaints because people are missing their show and the threat is not in their neighborhood. Honestly, I pay little mind to those comments and e-mails. We are required by the FCC to provide life-saving information and that is what we are going to do!

The Winter Forecast Stunk. Why? Let's Have A Fake Press Conference
Welcome everyone. I will take your questions now.
Q: The winter forecast was lousy, it stunk, it was off the mark, it went off the rails, it…well, it wasn’t good. True or false?
A: Yes. The temperature forecast:

What actually happened:

Oops.
Q: How could the forecast be that far off? Did you fall and hit your head?
A: Let me begin by saying that while my winter forecast was a stink bomb of epic proportions, many, MANY winter forecasts played up the potential for snow and cold much harder than I did. I advertised a colder than average winter but by small-ish margins. Some forecasts were ALL IN on the cold. So while my forecast was bad, it was “less bad” than many others.
Does that make me feel better? Nah, not really.
While I didn’t fall and hit my head (at least, I don’t think I did?), most, if not all, of the “conventional wisdom” of winter forecasting failed us this year. The general thinking by me (and most others) was this:
1) Weak El Nino or even a “neutral” signal in that part of the Pacific.
2) Winds at the very top of the atmosphere (the “QBO”) favored blocky patterns in the high latitudes, which can force cold into the eastern US for long periods.
3) We are at a “solar minimum”, with almost no sunspots and research has shown a correlation with solar minimums and high-latitude blocking.
4) The snow season got off to a ripping start in parts of Canada and across the pole in Siberia. This can encourage blocking patterns and help “refrigerate” air masses coming south from the arctic.
5) All of our top “analog” years were either cold or snowy or both. None showed a warm winter.
These were the building blocks of the forecast and they ALL FAILED.
Q: OK, so WHY? I mean, you should have seen this coming right?
A: There were 2 main villains in this story.
1) A highly unusual pattern in the INDIAN OCEAN. Remember the crazy Australian wildfires? They were associated with this funky pattern of ocean water temperatures called the Indian Ocean Dipole. Well, I think this anomalous event had far-reaching effects on weather patterns downstream in the Pacific and hence, North America. I talked about this in my late January blog post: https://www.ericwfmj.com/blog/why-has-this-winter-been-a-dud
2) A VERY strong polar vortex.
Q: Wait I thought the polar vortex brings the cold? Al Roker told me.
A: The polar vortex brings cold to our area when it departs it’s home over the North Pole and meanders and spreads out. When the vortex is spinning tightly like a figure skater with their arms tucked in, it keeps all that bitter cold locked up near the pole.
A strong vortex is associated with the POSITIVE phase of the “Arctic Oscillation” and the weak, meandering vortex is associated with the NEGATIVE phase.

Much research will go into this winter and why the arctic oscillation stayed so strong for so long. It’s possible that Indian Ocean pattern had something to do with it but we need the smart researchers in our science to look into it.
Q: Can the arctic oscillation phase be predicted?
A: It’s hard to predict the phase more than a few weeks in advance but our ability to do so may be improving. Interestingly, there WERE computer models that DID show the persistent positive AO lasting all winter. Those models were collectively ignored. It just didn’t seem like the right idea. Oops.
Q: What about climate change?
A: The changing climate almost certainly played SOME role (how much? hard to say right now) in how winter transpired in the Northern Hemisphere. The anomalous things in the Indian Ocean and over the Arctic, occurring against a background state of a rapidly warming planet…probably a perfect storm for the warmth.
Q: So with climate change happening and likely to get worse, will we EVER have a cold, snowy winter again??
A: YES. Our area will have winters like 1977-78 and 2014-15 again. But those kinds of severe cold winters will be less common as we go forward. Winters like 2019-2020 will not occur every year but winters of this flavor will be more common. The deck is stacked against cold. Every so often, cold can still win a hand but it’s going to lose the game.
Q:

A: That’s not a question. But I understand that it is easy to have recency bias. We have reeled off 5 straight warm winters.

But keep in mind that man made climate change has been happening for a while now and really started accelerating in the 80s and 90s. We have had cold winters over the last couple of decades. BUT, warm winters, especially VERY warm winters are certainly becoming more common.

Q: Hi it’s Barney from the Climate Denial Tribune. I see the warmest winters on record were in the 30s. No climate change then eh? Gotcha! This is all such a scam…my Facebook and Teevee programs told me.
A: Oh Barney.
It is true that much of the US was warm in ALL seasons in parts of the 30s. It was the Dust Bowl years. But a warm US does not make a warm world.
1930s:

The most recent decade:
![2010as].png](https://images.squarespace-cdn.com/content/v1/5d66ac33bcb9230001fbd5da/1583371369805-QPKRKIBGJ4W3SCWPHDFX/2010as%5D.png)
Q: So what lessons were learned?
A: I can’t speak for every meteorologist. But I will look more carefully at far-flung places such as the Indian Ocean when I am constructing my winter forecast. I have said before that climate change is likely making seasonal forecasting HARDER, while the accuracy of routine 3-day, 5-day, 7-day forecasts is quite good and always getting better. I will just have to dig in harder and rely lass on “analogs”, since the climate of years past is starting to bear little resemblance to the current atmosphere.
Q: Hi, Facebook Commenter Carl here. Pfffft. You can’t even get the 3-day forecast right, like you have a prayer of getting a seasonal forecast right. Peace out.
A: Hi Carl thanks for providing your valued opinion. This year’s winter forecast was bad, no doubt. But we have had many good ones. You just don’t remember them…most people don’t remember good forecasts just like they don’t remember the 90% of the calls a basketball referee gets right. They remember the bad ones.
As for routine forecasts, they are very good. Not the ones on your crummy weather app, mind you. But ones produced by experienced experts in the field of meteorology? They are much better than you think.
Q: So does this mean we will have a HOT summer??
A: There is usually little correlation between how a winter behaves and how a summer plays out. That said…we can expect hotter and wetter summers to become more common in the future as the climate continues to warm. Not every summer will be that way but the odds will be higher for that type of season each year. Every month of the year is warmer than it used to be, although the largest amount of warming has occurred in winter, not summer.

WHY Has This Winter Been A Dud?
IT WAS SUPPOSED TO BE A COLD WINTER. WHAT HAPPENED?
Back in late October when I was assembling the winter forecast, I was becoming convinced that this winter would be different than last. The winter of 2018-2019 was kind of a dud with only one sizable snow event (in January) and one significant cold snap (at the very end of January). The data for this winter suggested that this year certainly had a better chance of at least being “average” and odds were decent of it being colder than average. All these factors suggested cold:

Our “analog” winters were all on the cold side and some significantly so:

So I went out with a cold forecast although I did not advertise cold as zealously as many other winter forecasts. I said “the atmosphere just wants to be warm” and so I hesitate to go “all in” with cold until the atmosphere proves it can produce that kind of winter again.
OUR WARM WINTER: IS THE INDIAN OCEAN TO BLAME?
I try to learn lessons from every forecast bust, whether it be a snow forecast or a seasonal forecast. I have been thinking long and hard about what went wrong this winter and I have a theory.
Stuff that happened in the Indian Ocean, on the total opposite side of the globe, during the fall and early winter created a chain-reaction that doomed the prospect of any sustained cold for the first 2/3 of winter.
Say what? The Indian Ocean? Yep. The atmosphere is extraordinarily complex and nearly everything is connected. We make seasonal forecasts by looking at water temperature patterns across the Pacific Ocean, the Atlantic Ocean, the Arctic Ocean….and I need to look more at the Indian Ocean. Why?
THE IOD (INDIAN OCEAN DIPOLE)

You probably saw lots of news coverage of the devastating heat and wildfires in Australia earlier this winter (summer for them). It was absolutely horrible. Yes there are wildfires in Australia nearly every summer but this year’s were off the charts in terms of coverage and intensity. Why did that happen? Certainly climate change played some role. But a more localized phenomena likely is the main culprit. It’s called the Indian Ocean Dipole. This is basically the Indian Ocean version of the Pacific Ocean’s El Nino/La Nina. When there is colder than average water in the eastern Indian Ocean and warmer than average water in the west, the dipole is said to be in the “positive” phase. Well in 2019 the dipole went crazy…crazy positive. It was the strongest in years, probably decades.

So this extremely positive dipole likely triggered extreme heat and dry weather in Australia. What does that have to do with our winter? Well one of the premises of our winter forecast was that we would essentially be in a “neutral” phase of ENSO, or the El Nino-Southern Oscillation. In other words, not really an El Nino or a La Nina.
This has, in fact, been the case. The waters of the ENSO region of the Pacific have been running warm but not significantly so. Not enough to declare an El Nino.

While there is no El Nino, studies have shown some relationship between the IOD and the ENSO phase in the Pacific. I think the crazy positive IOD has made weather patterns over the Pacific (and then downstream into North America) MUCH more El-Nino-like than would have been the case in the absence of much an anomalous IOD event.
December’s temperatures compared to average:

January:

These maps have a very “moderate to strong El Nino”-ish look to them. Had I constructed the forecast under the premise that we would essentially be operating with a moderate/strong El Nino background state, I would have made a different forecast.
The 2 best analogs probably would have been 2006-2007 and 2004-2005, which give a map that looks like this:

WHAT ABOUT THE REST OF WINTER????
That crazy positive IOD is dead.
October’s water temperature anomalies (when the dipole was most positive):

Compare that to this week:

So the impacts of the crazy IOD spike are waning. I think the lack of “blocking” in the northern Atlantic and the Gulf of Alaska is likely to still be a factor in February, preventing cold from “sticking” for very long in the East. BUT…I do think a volatile pattern is likely with MORE FREQUENT cold hits than earlier in the winter. I also think February will be our snowiest month of this winter. The colder ideas are certainly hinted at by the most recent long range models.

Mid February

Mid/Late February
The latest long-range European model also has a colder look although it also suggests the cold will have a hard time planting it’s flag for extended periods as the ridge over the Southeast persists.
![14-km EPS 46-DAYS North America 7-d Avg T2M Anom [C].gif](https://images.squarespace-cdn.com/content/v1/5d66ac33bcb9230001fbd5da/1579830012644-V6FQ4V4SJEFJL6HSNLNN/14-km+EPS+46-DAYS+North+America+7-d+Avg+T2M+Anom+%5BC%5D.gif)
Long range forecasting is hard, and as I have mentioned before, is probably getting harder in a rapidly warming world. But I love the challenge and I love learning things about the atmosphere. The learning will never end.

Will Winter EVER Happen This Year??? Why Has It Been So Warm?
Now we are a week into January and lots of questions are being lobbed at me about the LACK of winter weather so far this season. Yes, we had a cold and snowy November but December and early January have been duds for snow/cold. And the forecast looks mighty balmy for the next week to 10 days. Let’s address some of the most common questions.
WHY HAS IT BEEN SO WARM AND SNOW-FREE?
The atmosphere is an extraordinarily complex fluid sitting on top of a rotating sphere. Figuring it out is hard! But humans are smart and the accuracy rate for day-to-day forecasts is exceptional (despite the tired old meteorologist jokes). But seasonal forecasting is a whole different ball game. There IS skill in this part of the meteorological enterprise but it’s nowhere near the skill we have in creating a forecast for the next 7-10 days.
There was a strong consensus that this winter would be a cold one in our area. Nearly every forecast (including mine) that I saw advertised at the very least a slightly cold winter and some went “all in” and suggested severe cold was plausible. I hedged by bets a bit and was not nearly as cold as some other sources. The atmosphere just “wants” to be warm lately. How could so many forecasts be wrong (at least so far)?? Well as I said this is hard…and perhaps getting harder. I think climate change is making the long-term predictability of the world’s weather patterns lower.
Aside from climate change, we can point to a couple of basic factors near North America that are preventing cold from taking hold in the East.
There is a distinct lack of “blocking” in the northern and western Atlantic, as well as around the arctic circle. Notice the jet stream is nearly west-to-east across the Atlantic. When the jet buckles and bulges north toward Greenland it can force cold down into eastern North America.

On the other side of the continent there have also been a persistent lack of jet stream buckling in key areas. When the jet buckles northward toward Alaska and western North America it will induce a trough of low pressure downstream, allowing cold weather to come far enough south and east to give us periods of wintry weather. Instead, the jet is sort of just plowing into the West Coast and that’s where all the wintry weather is.

There are other things going on, including as far away as the Indian Ocean, that are unfavorable for cold in our part of the world. It’s kind of a perfect recipe for unseasonable warmth.
IS THIS EL NINO OR CLIMATE CHANGE?
There is no stout El Nino signal this season. It can be argued that there is a very weak El Nino but essentially we are in the “neutral” phase. Some of our warmest winters have occurred in strong El Nino winters but that’s not the case this year.
On the subject of climate change, a warm stretch of weather over any part of the planet can’t be directly tied to climate change but climate change does “load the dice” in favor of more frequent extremes (on the warm AND cold side). The devastating wildfires in Australia are not happening 100% because of climate change but almost certainly climate change is “supercharging” them. For us, this unseasonably warm and snow-free weather would have probably occurred anyway but climate change probably made it some percentage more “extreme”. Remember “weather is your mood, climate is your personality”.
HAS THIS EVER HAPPENED BEFORE?
This is the warmest stretch of weather on record for the period between between Christmas and January 7th. It’s the 5th warmest stretch from December 1-January 6. Just a shade warmer than the same period last year actually. There have been 6 years with fewer snowfall between December 1-January 6 than this year. November 2019 was snowy so our seasonal snow, while below average, is nowhere near a record low right now.
IS WINTER OVER? WHAT’S COMING UP?
Winter is certainly not over. Is you consider our “snow season” to be roughly November 15-March 15, we are not even halfway done. Meteorological winter (December-February) is not halfway gone.
That said, after a cold and blustery day Wednesday, truly spring-like weather is on the way for the end of the week and start of the weekend. That does not mean sunny, beautiful weather unfortunately. At least an inch and perhaps nearly 2 inches of rain is likely Friday through Saturday night.

But check out these temperatures! If thing break just right I think 60s are attainable Saturday.

Beyond that, I think the pattern is largely a mild one through mid-month. There are signs of a “less warm” pattern starting around January 17th-20th but I see no evidence of harsh cold as of yet.
Tonight’s run of the long-range European model shows some cold periods late this month but actually has a warm pattern returning in February:

This contradicts another suite of long-range modeling from the European Center, which is broken down by month. It’s February outlook is a colder one:

This colder forecast jives with the last few runs of the American Climate Forecast System model:

Our winter forecast used “analogs”, or years we thought that were most similar to this one. Winter 2004-2005 appeared to be the most similar when looking at global ocean and atmospheric patterns. December 2019 behaved pretty similarly to December 2004. January 2020 will end up a fair bit warmer than January 2005. What happened in February 2005??
It was warm:

I looked at the warmest 1st halves of winter (December 1-January 15) on record in Youngstown
and how February+March played out. Here’s the composite of all those years:

Not a very warm looking map but 4 of those years did have a balmy February-March combo.
SO, WHAT’S GONNA HAPPEN?
There are conflicting signals surrounding February at this point. The smart money remains on warm rather than cold, given the long-term trends. But there will certainly be periods of cold and snow before spring settles in for good. Even in warm, benign winters we have several snow “events” and there’s still PLENTY of time for that to be the case this time around.
2019: The Year In Weather In The Youngstown Area
2019 is winding down and what an interesting year it has been weather-wise. Let’s talk about the big weather stories from this year but also some long-term trends.
The top 3 weather stories for our area:

#1: SEVERE FLOODING IN LATE SPRING AND EARLY SUMMER
This was an easy choice. For the second consecutive year, flash flooding led to huge problems in parts of our area, including the 224 corridor in Mahoning County. We also had massive problems in the Kinsman area. Mercer County was water-logged for much of late May and June.


#2: FOUR TORNADOES THIS YEAR
Our primary “viewing area” (Columbiana, Mahoning, Trumbull, Mercer counties) had it’s fair share of severe weather this year, including 4 confirmed tornadoes. 2 of these occurred in early JANUARY, a VERY unusual time of the year for tornadoes around here. Late in the morning on January 8, an EF1 tornado crossed parts of Trumbull County, including the Cortland area.

Path of January 8 tornado

Storm damage in Cortland area
Another twister occurred in NE Mercer County, around New Lebanon. That tornado was also rated as an EF1.

During the much more “typical” severe weather season of late spring and early summer, a pair of EF1 tornadoes impacted the southern half of Trumbull County. There was substantial tree damage in some places.

June 16 storms
#3: IT WAS ANOTHER VERY WARM YEAR
The Valley had it’s 4th consecutive very warm year in 2019. Only 2 months were cooler-than-average: March and November.

There were only a handful of true cold snaps: one in very late January, one in early/mid March and one in mid-November.

It was CONSISTENTLY warm in 2019 but we did not set that many daily records. No surprise but over the last 10 years record highs far outnumber record lows.

It was a very warm summer but once again the thermometer had a hard time getting above the lower 90s. It hit 91 six times. At the YNG airport it has not been warmer than 92 since 2012


Fewer 90 degree days in 2019 when compared to the previous year.
Remarkably, 1/2 of this decade is on the list of 20 warmest years on record in Youngstown.

HONORABLE MENTIONS
Some weather stories were noteworthy but didn’t make the list. Including:
-Late January cold snap, then rapid thaw: Highs in single digits, lows below zero on January 30, 31….high of 61 on February 4!
-Searing midsummer heat: It was a July on par with July 2011 and 2012…a few of the hottest Julys since the 1930s, 1940s and 1955. 7 days with highs in the lower 90s.
-Forever Summer: September was very warm for the 4th time in the last 5 years.
-Very cold November but very mild December: November and December traded places in 2019.
.
2 Weeks Away: What Are Chances For White Christmas This Year?
We are two weeks away from Christmas! Close enough now that we can take an educated guess at the chances for a “white” Christmas this year.
What’s a “White” Christmas?
No doubt there are varying definitions of a White Christmas throughout the country and throughout the world. A White Christmas in Atlanta might be thought of as someone seeing one snowflake on their windshield. We are heartier folk up here and our standards are a little higher! The definition of a “White Christmas” that we will use is:
1 INCH OF SNOW ON THE GROUND
Seeing snow falling on Christmas is not that uncommon around here in fact we see that on roughly 7 out of 10 Christmases. 1 inch of snow on the ground is less common but still almost happens half the time:

Of course the higher odds of having that much snow on the ground on December 25 are higher in the primary snowbelts of Ohio, Pennsylvania and New York.

What About This Year?
The pattern in the 5-7 days leading up to Christmas does not look WARM per se. We are unlikely to have a stretch with highs in the 60s. But, it does not look very cold either. The Lower 48 States as a whole will see a pattern dominated by Pacific air , not arctic air. This pattern will have a hard time generating a lot of opportunities for “pure” snow events. In other words, a pattern like this often is characterized by either 1) just rain events or 2) “slop” storms that bring some snow but also some rain and mixed precipitation.

So with that being the premise, I can’t forecast an above-average chance for a White Christmas this year. 2 weeks out, will go with about a 30% chance. We’ll of course spend a lot of time fine-tuning this forecast as we get closer. Stay tuned!

2019-2020 Winter Forecast
The LONG(LONG!) video version is here and/or you can check out the written version below. Leave a comment! Do you like the forecast??
It’s time once again for my annual winter forecast. It’s reasonable to ask: how good are these forecasts? Can you really do this?
The answer is YES. There is skill in these predictions. Is the skill as high as your typical 7-day forecast? No way. But there is a lot more skill in seasonal predictions than a total guess. This isn’t throwing darts. A good seasonal outlook has lots and lots of science behind it.
That being said, a case can be made that these outlooks are getting somewhat MORE difficult, despite advances in technology and knowledge. Why is that? Well a large part of creating a seasonal forecast is the reliance on “analogs”: years in which conditions in the atmosphere and oceans are similar to the current year. With the global climate (including ocean temperatures) warming so rapidly, looking at analog years before the 1990s or 2000s may be becoming impractical. The atmosphere was much different 40+ years ago.

LAST WINTER REVIEW
Last winter was a pretty uneventful one overall. December 2018 was mild and featured little snow. January was pretty by-the-books in terms of temperatures and snowfall, with one harsh cold snap at the end of the month. February turned quite mild (as it’s been prone to do in recent years).


We have reeled off 4 consecutive mild winters after back-to-back harsh ones in 2013-2014 and 2014-2015.
2019-2020 WINTER FACTORS
One of the first things we look at when making a winter forecast is: what’s the state of the water temperatures of the equatorial Pacific. This is where we look for El Nino (warm water) and La Nina (cold water). These water temperature anomalies can have a big impact on weather patterns in the northern hemisphere. This year things are looking pretty “neutral”, in other words there’s not much going on in this part of the ocean. A very weak El Nino may be brewing but La Nina is off the table. The most likely phase for the winter is “neutral”.
Another important area to look at is the northern Pacific, where there is a lot of warm water right now. This can encourage a ridge of high pressure to park over that region, which has implications for North America.

It was a wet summer in the Plains and a dry one in the Southeast. So? Well soil moisture can be an important factor when determining where ridges and troughs like to set up as we get into winter. Ridges of high pressure tend to want to hang out over dry areas. The opposite is true for troughs of low pressure.

It can be useful to know what the condition of the sun is. HOT right? Well for the purposes of the forecast, we want to know if the sun is “quiet” (few sunspots) or “active” (lots of sunspots). Why? Recent research shows that a quiet sun can help to encourage blocking patterns in parts of the northern hemisphere during winter. Blocking patterns can result in “stuck” weather patterns where dry/warm regimes and stormy/cold regimes don’t want to break. We are in a solar “minimum” now and likely will be for a few years.

The snow season is off to a fast start across parts of Canada. A deep, well-established snow pack can act as a refrigerant for arctic air masses descending from the high latitudes. Essentially, already cold air masses can be further cooled by traversing a snow-covered landscape.

LET’S GET TO THE FORECAST
Ok, I have gone over SOME of the things that are important pieces to this year’s forecast puzzle. There are many more but I don’t want everyone’s eyes to glaze over. Let’s get to the forecast.
My list of top analogs this year:

A lot of cold winters on that list. A couple of snowy winters and some not-so-snowy ones too. Overall I think 2004-2005 is the best match for this year.
Based on analog and computer model data, here’s the forecast. A wetter-than-average winter in our region:

The temperature forecast features warm weather in the West and the Southeast. Highest chances for a colder-than-average winter will be across the northern Great Lakes and parts of New England. I lean toward an average to perhaps slightly colder-than-average season here.


Given the analogs, this may be a conservative temperature forecast. Why is my forecast not colder? First of all, I really like 2004-2005 as an analog and that was a pretty average winter temperature-wise. Secondly, weak El Nino or neutral winters tend to trend toward recent climatology. What do I mean? Without a strong Nino/Nina signal, a good place to start when making the forecast is averaging together the last handful of winters. Here’s what that map looks like:

In addition, the atmosphere seems to “want” to be warm over our area. March is the only month that has been colder-than-average in 2019 (November should be month #2). 2018 only had 3 cooler-than-average months. You’d have lost a lot of money betting on cold over the last couple of years. Maybe the next few months will be different but until proven otherwise, I’m very hesitant to predict much unusual cold.

Snowfall is likely to be the biggest change from last year. I expect us to see a much snowier winter, with most places averaging 10-20% more snow than average.

Another way to compare last winter and this winter is like this:

IMPACTS
Expect higher energy bills this winter when compared to last, although again I do not think it will be a harsh winter. Salt usage will be higher with more snow on the way. As there are every winter, of course there will be occasional school adjustments.

